
Target Analysis Report — Probability Table Analysis
Context
This analysis report is available for any Target Node. It allows computing the impact on the Target State when slightly modifying one probability of a node’s Conditional Probability Table. This is done for each cell of each relevant conditional probability table.
The sensitivity function used is:
where represents the hypothesis (Target Node = Target State), represents the context, and the probability.
The derivative of this function is computed, as well as the minimum and maximum values when setting the probability to 0% and 100%.
This HTML report has several sections:
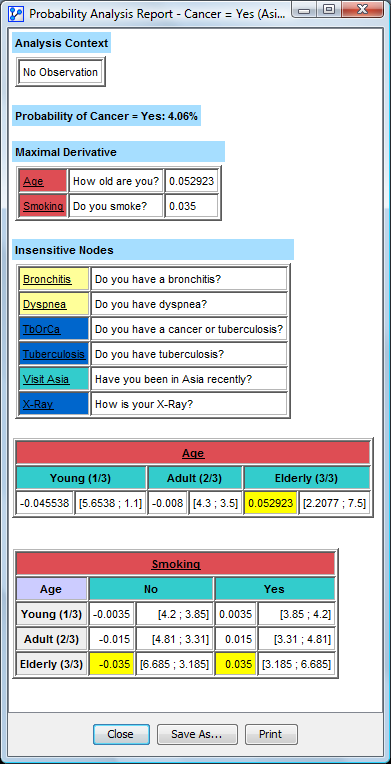
Analysis Context
Provides a description of the observed variables when the analysis is carried out.
Probability of the Target State
Probability of the target state given the observed variables (context).
Maximum Derivative
This table summarizes the nodes with a maximum derivative different from zero. It is ordered from the greatest to the smallest derivative.
Insensitive Nodes
This table contains the nodes with a derivative equal to zero.
Tables of Sensitive Nodes
For each sensitive node, a table represents each combination of its values and its parents’ values. Each cell contains two parts:
- The part on the left indicates the derivative computed for each combination of states. The background of the maximal derivative is yellow.
- The part on the right shows the probabilities of the target state when the probability of a current node’s state is set to 0% and to 100%. These probabilities are symmetric for binary nodes.