
Target Analysis Report — Direct Effects on Target
This analysis produces a tabular report. The equivalent visual analysis, which plots the Direct Effect Curves, is Target Mean Analysis (Direct Effects).
Context
This report lists, for each selected node, its Direct Effect on the Target Node together with three derived measures. The Direct Effect is the change in the mean of the Target Node that accompanies a small change in the mean of the node while the other nodes in the network are held fixed. By default, BayesiaLab fixes all other nodes except those in the predefined class Non_Confounder and Not-Observable nodes in the class Factor. The concept page explains the definitions, how the values are computed, and how they relate to the Total Effect.
Usage
Make sure you have defined a Target Node. In Validation Mode F5, select the nodes of interest and go to Menus > Analysis > Report > Target > Direct Effects on Target. If you have not selected any node, BayesiaLab will use all connected and observable nodes for the analysis.
Report
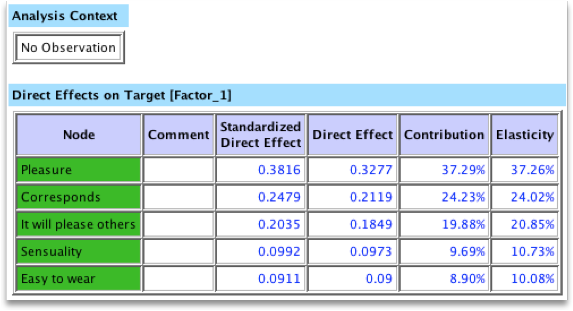
The report has one row per selected node and four measures:
- Direct Effect: the derivative of the node’s Direct Effect Curve at its a priori mean, i.e., at Delta Mean=0.
- Standardized Direct Effect: the Direct Effect multiplied by the ratio of the standard deviation of the node to the standard deviation of the Target Node.
- Contribution: the node’s share of the absolute Standardized Direct Effects of all selected nodes. The Contributions add up to 100% and depend on which nodes were selected.
- Elasticity: the change of the Target Node relative to the change of the node, each measured relative to its own range of values.
Positive effects are displayed in blue and negative ones in red.
Example
The example below is taken from Chapter 8: Probabilistic Structural Equation Models for Key Driver Analysis, with as the Target Node and four Driver Nodes.
| Node (Driver Variable) | Value/Mean | Standardized Direct Effect | Direct Effect |
|---|---|---|---|
| Pleasure | 6.05 | 0.48 | 0.4 |
| Corresponds | 5.76 | 0.4 | 0.33 |
| Easy to wear | 6.5 | 0.1 | 0.1 |
| Intensity | 3.07 | -0.01 | -0.03 |
The Direct Effects are the slopes of the Direct Effect Curves at Delta Mean=0:
To make the values concrete, the following panels compare the marginal distributions of the Target Node and the Driver Nodes (on the left) with the posterior distributions of the same nodes after simulating a one-unit increase (using MinXEnt) for while the other Driver Nodes are held fixed (on the right). Here, the +1 increase in raises the mean value of the Target Node by 0.272 units. The same +1 increase raises the Target Node by 0.78 units when the other nodes are free to respond, i.e., in the Total Effect analysis.