
Monitors
Context
Monitors play a central role in inference and analysis in BayesiaLab. Each Monitor represents, or “monitors”, a corresponding node in the Graph Panel. However, beyond the passive monitoring of nodes, Monitors allow you to interact with nodes, for instance, by setting observations on nodes via the Monitors.
Usage
The following chapters explain all of the Monitors’ elements and how to use them.
States
A monitor can be in different configurations depending on the type and the condition of the corresponding node:
Normal
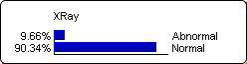
By default, a Monitor shows the probability distribution of the states of the corresponding node.
Hard Evidence
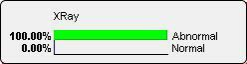
If you set Hard Evidence, the selected state is highlighted with a green bar.
Setting Soft Evidence
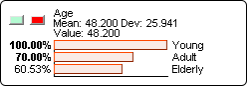
If Soft Evidence is set, the bars represent the likelihood of each state.
Soft Evidence Validated
After validating soft evidence with the light green button.
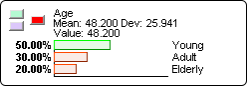
Setting Probabilities
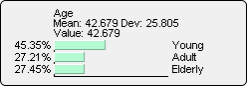
Setting Probabilities directly specifies the probabilities for each state.
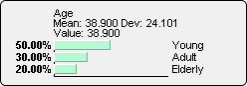
Likelihoods Validated
Likelihoods validated from probabilities: after validating probabilities with the light green button.
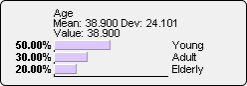
Fixed Probabilities Validated
Fixed probabilities validated: after validating probabilities with the mauve button.
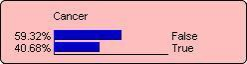
Target
Target: probability distribution of the Target Node.
Target & Target State
Target + Targeted Value: probability distribution of the Target Node within the framework of an adaptive questionnaire centered on a target value. The target value probability appears in light blue.
Temporal
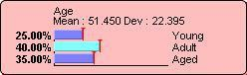
Temporal: probability distribution of a temporal parent node (current time step).
Utility
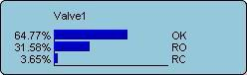
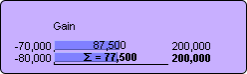
Utility: expected value of the utility node and the sum of all the expected utilities (in bold). These values appear with their respective minimal and maximal values.
Decision
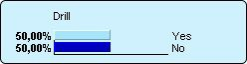
Decision: displays the probability distribution of the actions corresponding to a decision node (equiprobable except when descendant nodes are observed). The recommended action with respect to the context appears in light blue. This action corresponds to the one with the best-expected quality, which can be displayed by pressing the  key while pointing at the monitor.
Not Observable
Not Observable: there is no cost associated with the node, so it won’t be proposed in the adaptive questionnaire and it won’t be observed in the interactive inference, interactive updating, batch labeling, or batch inference.
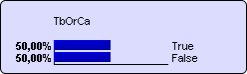
Causal
Causal: probability distribution of a causal node.
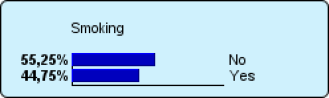
Fix Current Probabilities
It is possible to quickly fix the current probability distributions of the selected nodes by using the [Monitor Contextual Menu]. All the selected nodes will have their own current marginal probabilities as fixed probabilities.
Set Negative Evidence
It is possible to quickly indicate an impossible value (zero likelihood value)
by keeping the Ctrl key pressed while double clicking on the state that is
impossible.
Select Evidence in the Evidence Scenario File
If an Evidence Scenario File is associated with the network, the icon
is displayed in the network’s Status Bar. In Validation Mode, a right-click on the icon
displays a list of the evidence sets contained in the evidence file:
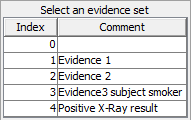
Simply click on one of the evidence sets in order to set the corresponding observations (if it is possible). This option is disabled in the context of temporal networks and during interactive inference and updating.
Select Evidence in the Database
When a database is associated with the network and has Row Identifiers, a
right-click on the database icon in
the Status Bar in Validation Mode displays a panel allowing you to search the
Row Identifiers. The search criterion can be entered into a text field. The
wildcard characters ? and *** can be used. ? can replace one and
only one character. *** can replace none or several characters. The Case Sensitive option specifies a case-sensitive search. After pressing Enter, the
search is performed and the list of the results is displayed. The number of
corresponding rows is displayed at the bottom of the panel. A click on a
specific row applies the recorded values in the row as a set of evidence:
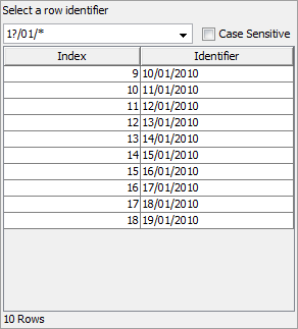
For each row, the evidence is set on each node according to the values recorded in the dataset. The only exceptions are Target Nodes and Not Observable nodes. This option is disabled in the context of Temporal Networks, for Automatic Evidence-Setting, and Parameter Updating.
Remove Soft Evidence
Soft Evidence can be removed by using the Monitor Contextual Menu.
Define Target Node
You can define the Target Node and its Target State by holding the T key
pressed while double-clicking on the Target State of the node. Double-clicking
on the current Target State removes the “target” property from that node.
Node Centering
Pressing the C key while clicking on a monitor, or on the selected monitor,
centers the network graph on the associated node and makes that node flash for a
few seconds.
Node Selection
Pressing the S key while clicking on a monitor, or on the selected monitor,
selects the corresponding node on the Graph Panel.
Monitor List
The arrangement of the monitors inside the Monitor Panel can be reordered by simply dragging one or more selected Monitors and dropping them into the desired position.
Exact Probability Values
The probabilities displayed in the monitors are rounded by default. If a
probability value happens to be exact without any rounding applied, that value is
displayed in bold. For instance, 10.000000000000…% would appear as 10.00%,
whereas 10.0035% would be displayed as a rounded value, i.e., 10.00%, but not in
bold. However, you can always display the exact probabilities by holding the I
key while hovering with your cursor over the monitor.
Probability Variation
This feature visualizes the change of probabilities of each state of each monitor after setting new evidence.
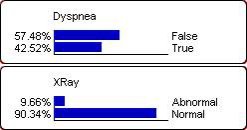
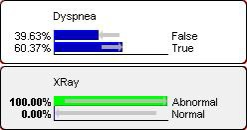
A double click on the monitor, outside the state zone, or pressing the button
 resets the arrows.
The button

of the monitor’s toolbar sets the current probability distributions as the reference state for the computation of the probability variations. In that case, resetting the arrows is not possible.
The button

displays the maximum positive and negative variations among all states of all nodes after applying a new set of evidence.
Displaying Computed Value
If a node has values associated with its states, the resulting value, computed according to the probability distribution, is displayed. If the node doesn’t have any values associated, if the node is continuous, the mean of each interval (computed from the data if a database is associated or the arithmetical mean is taken) is used. Otherwise, if the node is discrete with integer or real values, these are used. The option allows, as for the probability variations, visualizing the value variations between each modification of the evidence set. These variations are displayed to the right of the value.
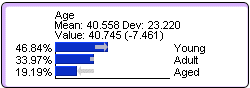
Displaying the Monitors’ Tooltips
By pressing the key
and moving the cursor over a monitor, a tooltip containing information about the monitor is displayed.
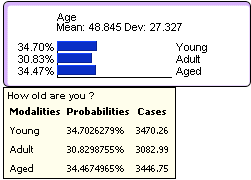
It contains the comment of the node if any or the name of the node if the comment is displayed instead of the name in the monitor. It contains a table with the states’ names as the first column, the corresponding probabilities as the second one, and the number of cases each state represents according to the evidence. This last column is displayed only if a database is associated with the network.
Copy & Paste
Monitors can be copied and pasted into external applications. They can be pasted as images or data arrays in plain text or in HTML format. In addition to the probabilities, the mean, standard deviation, and value are also copied if available.
Zoom
The Zoom level of the Monitors can be changed with the corresponding buttons in the monitor toolbar.