BayesiaLab
BayesiaLab is Bayesia’s core desktop environment for building, learning, analyzing, and operationalizing Bayesian network models.
It helps researchers, analysts, engineers, and decision teams transform expert knowledge, data, and GenAI-assisted knowledge mining into transparent models for reasoning, diagnosis, simulation, risk analysis, and decision support under uncertainty.
Built on the Bayesian network framework, BayesiaLab makes uncertainty explicit: variables, assumptions, causal hypotheses, evidence, and probabilistic relationships can be modeled, inspected, challenged, and communicated.
BayesiaLab is available for Windows, macOS, and Linux/Unix environments.
Why BayesiaLab
- Model uncertainty explicitly: represent variables, assumptions, dependencies, evidence, and probabilistic relationships in one transparent framework.
- Combine expertise, data, and GenAI: build models from expert knowledge, learn from data, mine knowledge from language and documents, or combine all three.
- Reason in every direction: use evidence anywhere in the network for diagnosis, prediction, simulation, causal analysis, and decision support.
- Move from analysis to action: support adaptive questionnaires, batch inference, web simulation, APIs, and operational deployment.
- Communicate complex reasoning: use graph-native models and probability-based outputs that stakeholders can inspect, question, and explain.
BayesiaLab is used by researchers, data scientists, engineers, policy analysts, market researchers, reliability specialists, and decision-support teams working with complex systems under uncertainty.
Core Capabilities
Knowledge Modeling from Expert Knowledge
- BayesiaLab allows subject-matter experts to encode causal and probabilistic domain knowledge directly in a Bayesian network.
- Nodes and arcs provide a direct graph representation of variables and relationships, with causal direction encoded through arc orientation.
- Probabilistic relationships are represented through Conditional Probability Tables (CPT), with no fixed functional-form assumption.
- Continuous variables can be discretized manually or automatically via workflow tools.
- Expert elicitation is supported through the Bayesia Expert Knowledge Elicitation Environment (BEKEE).
Knowledge Discovery from Data
- BayesiaLab learns Bayesian network structures and parameters from data, helping users discover probabilistic relationships without predefined input/output roles.
- Learning criteria are information-theoretic, including Minimum Description Length (MDL), without requiring distributional assumptions.
- Unsupervised Structural Learning discovers probabilistic structure without predefining predictor and target variables.
- Supervised Learning workflows target predictive performance for selected outcomes while controlling model complexity.
- Clustering workflows include Data Clustering, Variable Clustering, and Multiple Clustering.
Knowledge Mining with Hellixia
- Hellixia is BayesiaLab’s Generative AI assistant for turning questions, documents, and expert context into Bayesian network assets.
- It can help extract semantic, causal, and probabilistic structure from natural-language prompts and source documents.
- Document workflows can produce structured artifacts such as Semantic Networks, Causal Networks, Knowledge Graphs, Causal Semantic Diagrams, Semantic Flowcharts, and Doc-to-Node outputs.
- Enrichment tools support variable elicitation, class descriptions, comments, translations, embeddings, and semantic clustering.
- Causal-analysis workflows can surface candidate causal directions, explanations, and structural priors for downstream modeling and learning.
Inference, Diagnosis, Simulation, and Causal Analysis
- Bayesian networks represent a Joint Probability Distribution, enabling omnidirectional inference across all nodes.
- BayesiaLab supports exact and approximate observational inference with hard, likelihood/virtual, probabilistic/soft, and numerical evidence.
- Diagnosis, prediction, and simulation are all evidence-conditioned inference workflows.
- Causal inference workflows support intervention analysis, including Pearl’s Graph Surgery and Jouffe’s Likelihood Matching.
- Effects can be explored through simulation-based workflows such as total effects and target mean analysis.
Deployment and Model Utilization
- The Adaptive Questionnaire selects the next best evidence to acquire by balancing information gain and acquisition cost.
- WebSimulator publishes interactive models and adaptive questionnaires for web-based use.
- Batch Inference and the optional Code Export Module support embedded and large-scale operational deployment.
- The Bayesia Engine API provides modeling, inference, and learning capabilities through Java libraries.
Knowledge Communication
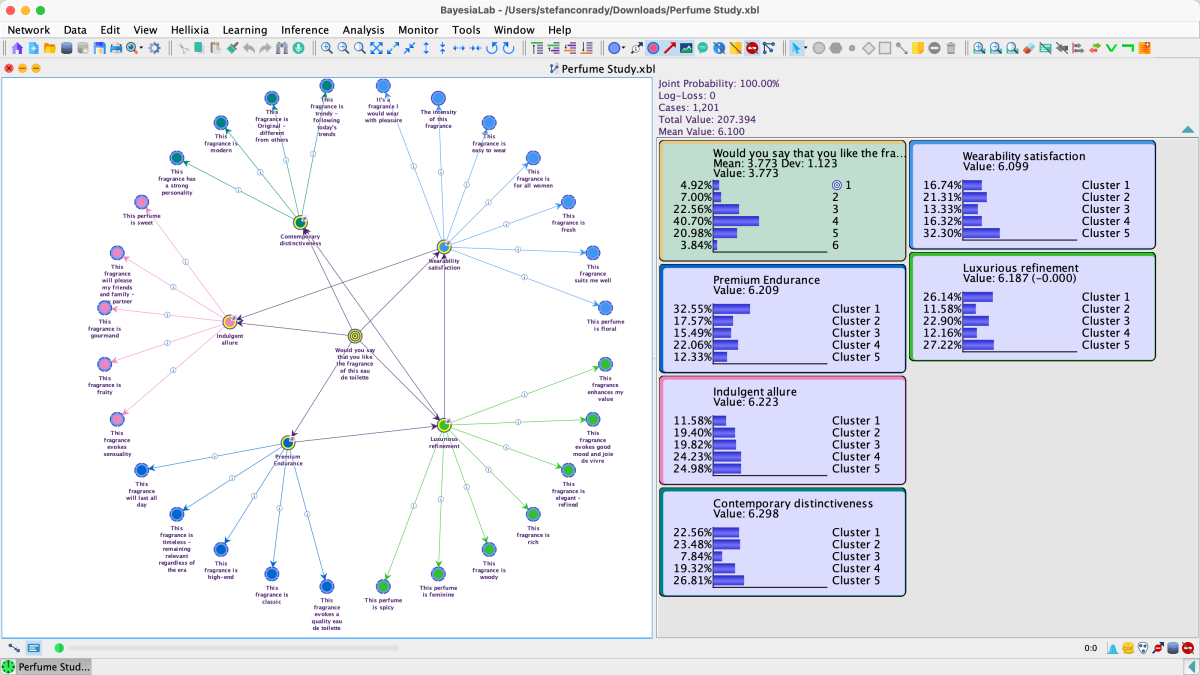
- BayesiaLab supports knowledge communication through graph-native representation, interactive simulation, and visual analysis.
- Technical users can inspect model structure and behavior directly to extract interpretable insight from probabilistic models.
- Visualization workflows include 2D, 3D, and VR-oriented perspectives for communicating relationships, effects, and scenarios.
- Diagrams and probability-based outputs help stakeholders inspect, challenge, and explain model assumptions and conclusions.
Typical Use Cases
BayesiaLab is used for problems where decisions depend on incomplete evidence, uncertain causal relationships, expert judgment, and explainable outputs, including:
- Decision support and policy analysis
- Risk, reliability, and resilience modeling
- Diagnosis and root-cause analysis
- Scenario simulation and intervention planning
- Market research and customer analytics
- Industrial systems and engineering analysis
- Health economics and public-sector modeling
- Intelligence, geopolitical, and strategic analysis
Start Here


About BayesiaLab
BayesiaLab has been developed for more than twenty years by Dr. Lionel Jouffe, Dr. Paul Munteanu, and the Bayesia team. Bayesia S.A.S. is headquartered in Laval, France, with affiliates in the United States and Singapore. Bayesia serves major corporations, research organizations, and public-sector users around the world.
For version-specific feature updates and release notes, visit What’s New in BayesiaLab.