
Batch Learning
Context & Motivation
In BayesiaLab, the MDL Score is the principal measure for evaluating the quality of a machine-learned Bayesian network. Running any learning algorithm will return the network that has the minimum MDL Score among all the candidate networks evaluated with the given algorithm. However, there is no guarantee that a lower MDL Score couldn’t be found elsewhere in the enormous search space. Therefore, the minimum MDL Score obtained so far must be considered only a local minimum.
Given that the search space of possible networks is typically astronomical in size, an exhaustive search is rarely possible. However, we can expand the search by pursuing alternative search strategies, i.e., using different learning algorithms. In general, we recommend that you try out several additional learning algorithms, beyond your initial choice. This allows you to see whether another learning strategy may find a better network, i.e., a network with a lower MDL Score.
For datasets with a large number of variables and many observations, learning can be time-consuming. Hence, evaluating multiple algorithms back-to-back may not be possible. With the Batch Learning function, you can define a list (or “batch”) of learning algorithms that BayesiaLab processes. This allows you to evaluate many algorithms in the background, perhaps even letting your computer run overnight. Also, BayesiaLab can take advantage of parallel processing on computers with multi-core processors.
Usage
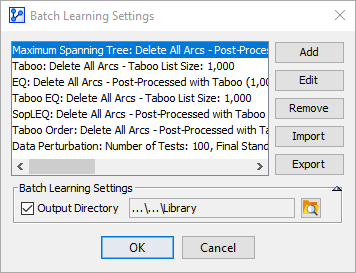
To initiate Batch Learning, select Menus > Tools > Multi-Run > Batch Learning. The Batch Learning Settings window allows you to add any of BayesiaLab’s learning algorithms:
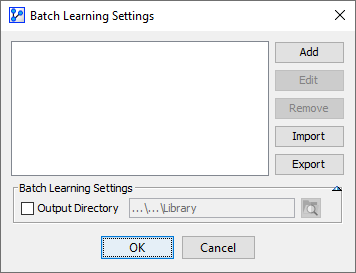
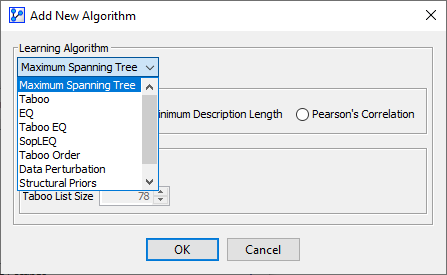
Click Add to select from the list of learning algorithms.
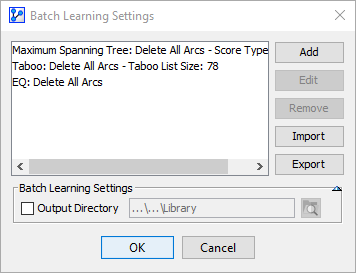
The selected algorithms now appear in the list, along with their specified options.
To edit the options of an algorithm that has already been added, highlight it on the list, then click Edit.
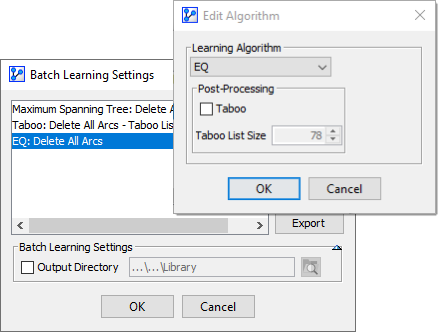
Click Remove to delete the highlighted algorithms from the list. To save the current set of algorithms for future use, you can save the list as an XML file: click Export and select a file name. Clicking Import allows you to bring back a previously-saved XML file with learning algorithm definitions. By checking the box Output Directory at the bottom of the Batch Learning Settings window, you can specify to save all the networks generated with Batch Learning in the directory you choose.
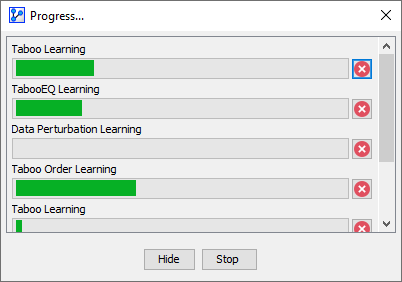
Once you click OK, the Batch Learning starts and a progress window opens.
Arc Confidence Analysis Report
Upon the completion of all learning processes, BayesiaLab presents the Arc Confidence Analysis Report.
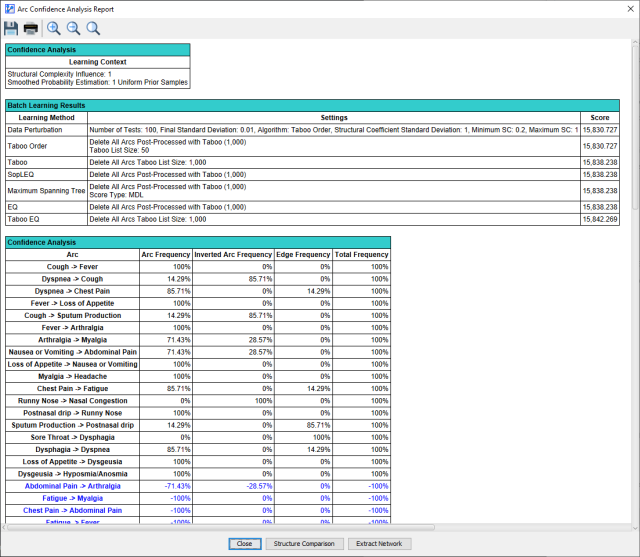
This report is similar to the Arc Confidence Analysis Report that is generated in the context of Resampling.
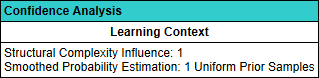
The top table in the report provides context for the analysis, such as the Structural Coefficient and the Number of Uniform Prior Samples.
The Batch Learning Results table lists all the learning algorithms along with their parameters.
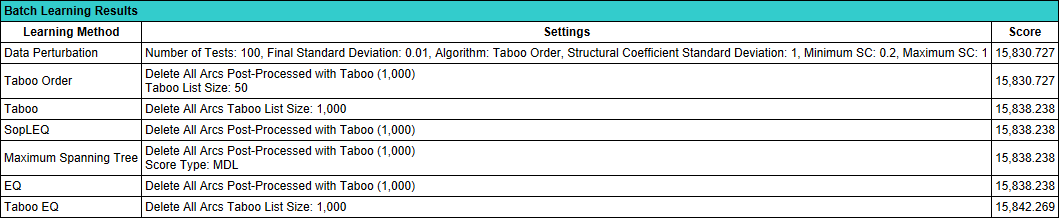
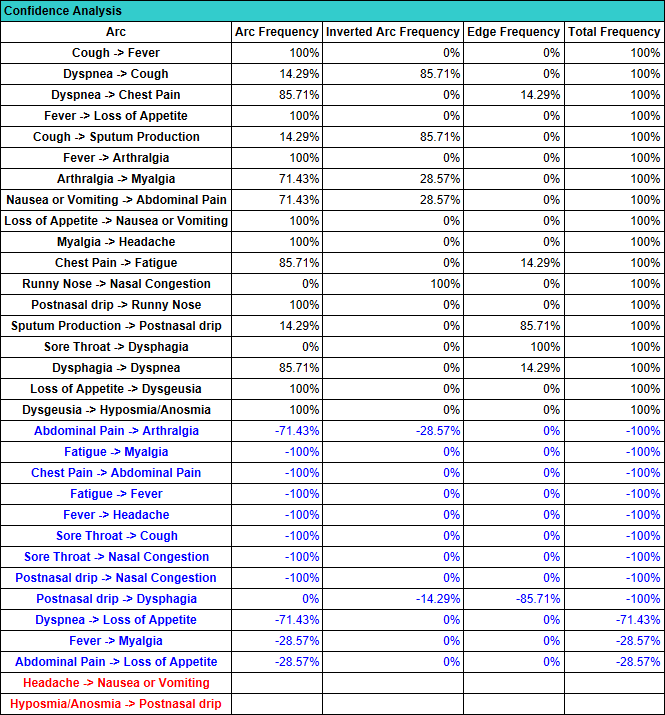
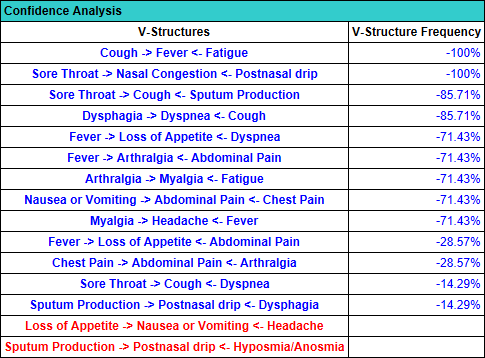
The rightmost column labeled Score shows the MDL Score, according to which the table is sorted in increasing order. As a result, the minimum MDL Scores along with the corresponding learning methods are at the top of the table. In our example, we have several ties in terms of MDL Score values, suggesting that some algorithms produced the same network. The next two tables refer to the confidence analysis of individual arcs and V-structures of the network.
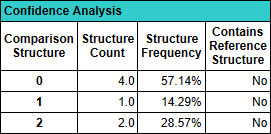
The third Confidence Analysis table lists the unique Comparison Structures that were found by all the search algorithms. The rightmost column, Contains Reference Structure, indicates whether the Reference Structure is contained within the Comparison Structures. The Reference Structure refers to the current network at the Batch Learning process.
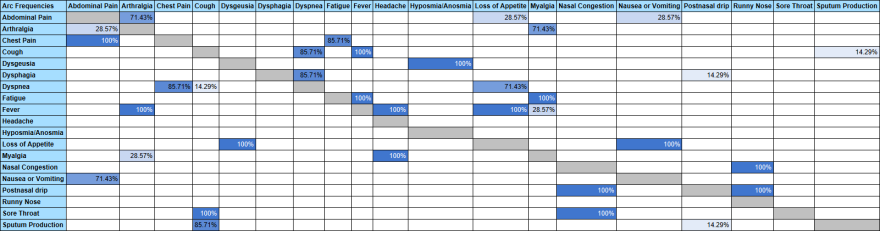
The Arc Frequencies Table shows how often a particular arc was found in all of the networks learned during Batch Learning. The column on the left refers to the arc origin (i.e., the parent node) and the row across the top of the table refers to the arc destination (i.e., the child node).
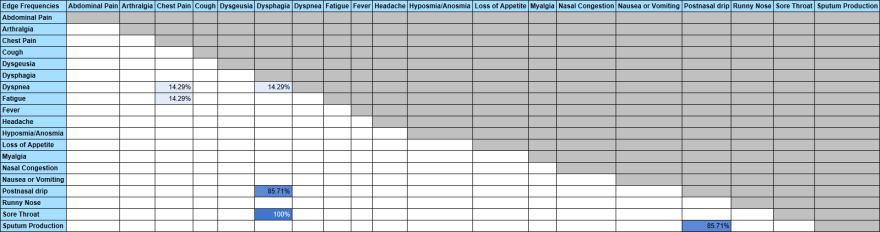
The Edge Frequencies Table shows how often a particular edge was found in all of the networks learned during Batch Learning. As edges are undirected, there is no distinction between origin and destination, so all cells above the diagonal are grayed out.
Clicking the Structure Comparison button at the bottom of the Arc Confidence Analysis Report brings up the Structure Comparison Window.
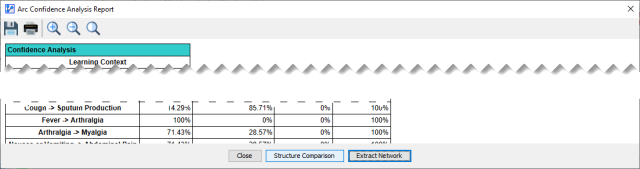
Structure Comparison Window
The Structure Comparison Window is not exclusive to the Batch Learning function. It is available in the context of other learning processes that produce a variety of Bayesian networks for comparison and evaluation purposes.
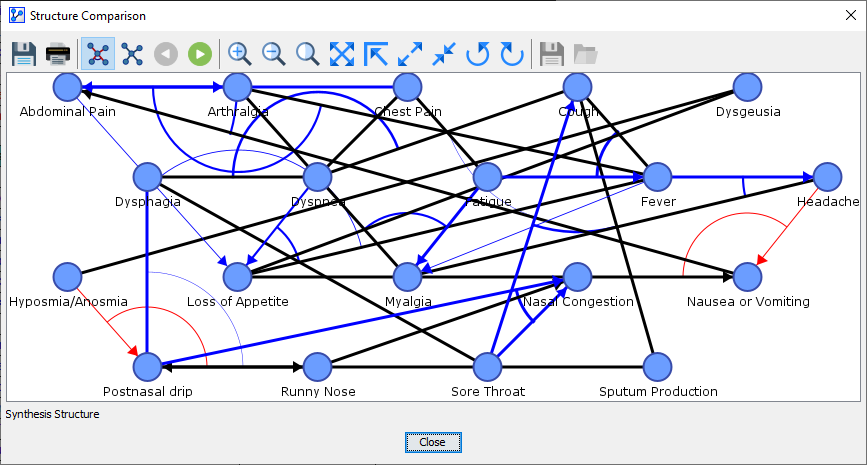
The default view presents the Synthesis Structure. In this visualization, all arcs and edges discovered with any of the learning algorithms are superimposed into a single graph. However, it is not an actual Bayesian network. Rather, it is meant to highlight the differences between the Reference Structure and all the Comparison Structures. In this context, the thickness of the arcs and edges is proportional to their frequency in the set of Comparison Structures as a result of Batch Learning. For more details regarding the features and properties of the Structure Comparison Window, please see Structural Network Comparison in Analysis Context.