
Data Perturbation
Context
The menu item Menus > Tools > Resampling > Data Perturbation can help escape local minima in which the network structure may be trapped. The network must have an associated dataset, and Validation Mode must be active.
BayesiaLab’s structural learning algorithms are based on heuristic search, so they may be trapped in local minima. Because the algorithms use different heuristics, the local minima are not necessarily the same for all algorithms. Applying each algorithm and choosing the one with the lowest score is one way to optimize the model. The Data Perturbation tool provides another approach by adding noise to the weights associated with each row of the dataset to try to escape local minima.
Noise is generated using a Gaussian distribution with a mean of 0 and a standard deviation set by the user. The selected learning algorithm is applied to this perturbed dataset, and the score of the final structure is computed using the original weights. The decay factor is applied after each iteration to reduce the standard deviation.
Parameters
Select the learning algorithm you want to use, and indicate the initial standard deviation, the decay factor, and the number of tests to perform in the following dialog box:
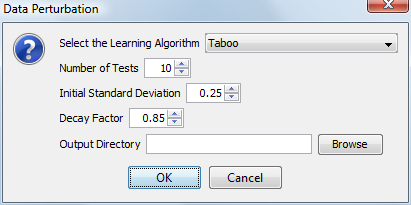
An output directory can be specified where all learned networks will be saved.
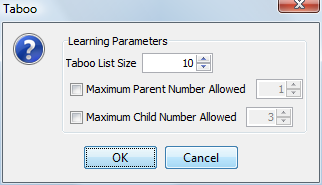
Depending on the chosen learning algorithm, a dialog box displays specific settings:
Analysis Report
Once the networks have been learned, the following report is displayed:
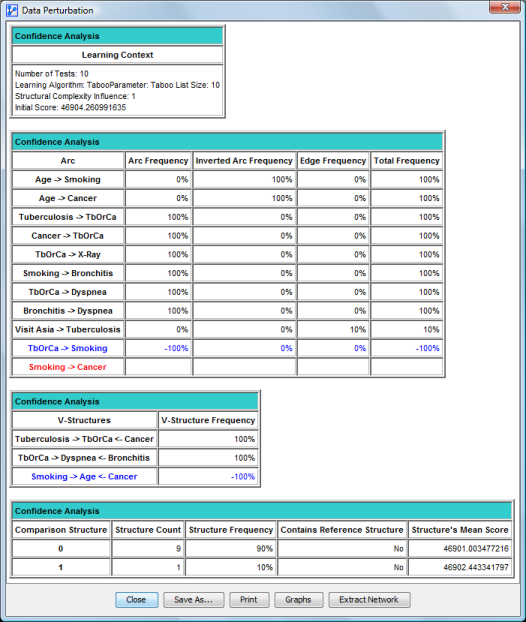
This report is similar to the Arc Confidence report, except for the last table where the column indicating the Structure’s Mean Score is added.
The report can be saved as an HTML file. It can also be printed. Two other options exist: displaying graphs and extracting the network.
Graphs
The Graphs button from the report allows displaying the graphical structure comparator. With this tool, data contained in reports can be viewed and interpreted easily.
Extracting the Network
The Network extraction button from the report displays the network extraction tool. This tool allows building a network from any structure depending on arc frequency thresholds.