
Correlations with a State of the Target Node
Within this visualization function, you can display two pieces of information for each node relative to the Target Node:
- The general pattern of the relationship between each node and the Target Node.
- The Mutual Information between each node and the Target State.
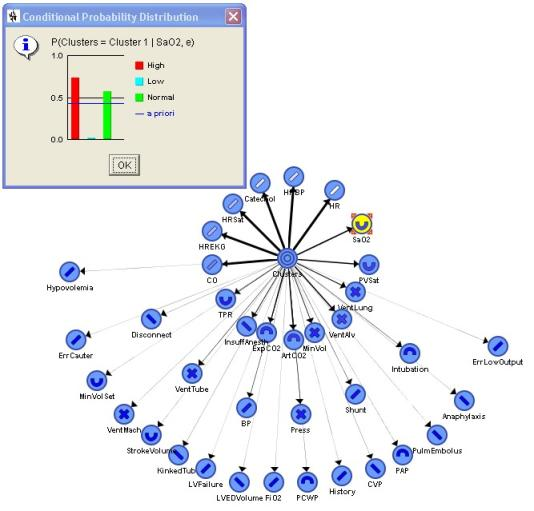
The symbol inside each node schematizes the pattern of the Target State’s probability distribution (CLUSTERS), conditioned on each value of that node. For example, see the pattern of node CATECHOL relative to its associated distribution, obtained from the node’s Node Contextual Menu > Influence Analysis wrt Target Node.
The symbol  indicates that the distribution curve does not correspond to any of the four basic patterns.