
Gauge Style
Context
The Gauge style adds a gauge or dial appearance to a node in the Graph Panel. It is particularly suitable for continuous nodes representing outputs or results.
Loading SVG...
The Gauge display dynamically updates based on the node’s Value.
Usage
-
Select the node(s) you want to modify.
-
Apply the Gauge style using one of the following methods:
-
Select
Menus > View > Node Style > Gauge. -
Select the
Gaugeicon from the dropdown menu in the Toolbar.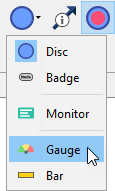
-
Select
Node Contextual Menu > Properties > Node Style > Gauge.
-
-
Behavior in different modes:
- Modeling Mode: The Gauge style shows a color scale but no values.
Loading SVG...
- Validation Mode: The color scale corresponds to the minimum and maximum values the node can represent.
Loading SVG...
-
Features:
- If the node’s value changes due to evidence, the change is displayed as a color band.
- The numerical delta value is shown at the bottom of the gauge.
-
Customization:
-
Access full customization options via
Node Contextual Menu > Properties > Rendering Properties > Edit All.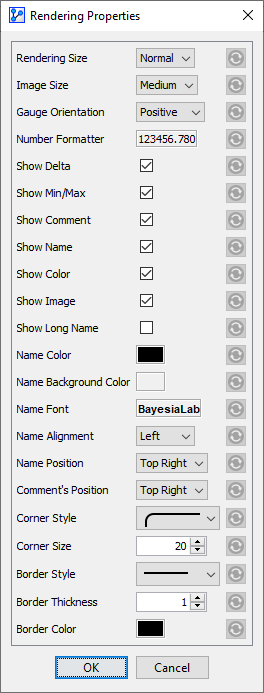
-
-
Gauge Orientation:
- You can adjust the orientation based on the interpretation of the values:
- Negative Gauge Orientation: For lower-is-better values.
- You can adjust the orientation based on the interpretation of the values:
Loading SVG...
- Positive Gauge Orientation: For higher-is-better values.
Loading SVG...