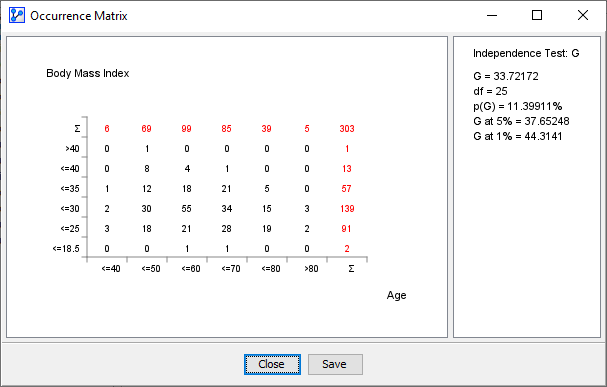
Occurrence Matrix
Context
The Occurrence Matrix graph displays a two-dimensional table of the selected variables plus the statistics of the corresponding independence test.
Usage
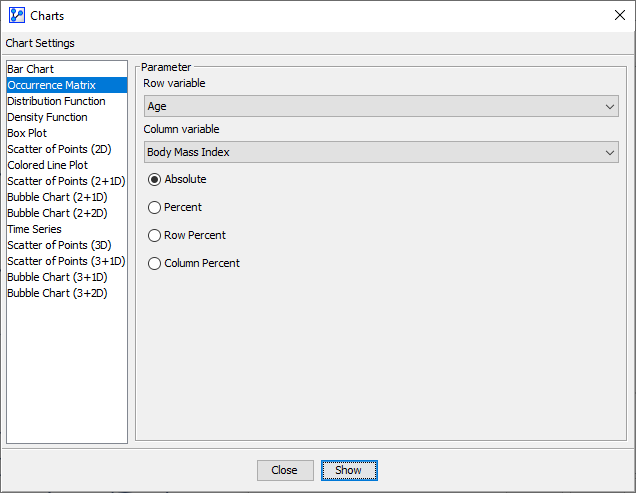
You can access the Occurrence Matrix function in multiple ways:
Menus > Data > Charts > Occurrence Matrix.Node Contextual Menu > Charts > Occurrence Matrix.
In the Parameter panel, select any of the available variables from the dropdown lists:
- Select the
Row Variable. - Select the
Column Variable.
If you had nodes selected when you opened the Charts window, the variables in the dropdown menus are restricted to that selection.
Check one of the following options:
- Absolute.
- Percent.
- Row Percent.
- Column Percent.
If a learning/test split is defined, you can also specify which subset to use. Click Show to produce the chart.
The right panel contains all the information about the χ² test or G-test, plus the computed degrees of freedom. You can choose the type of independence test, G or χ², under Menus > Window > Preferences > Tools > Statistical Tools. Note that Missing Values are not taken into account for the independence test, but Weights are.