Distribution Function
Context
The Distribution Function chart shows the Cumulative Distribution Function (CDF) of the selected variable.
Usage
You can access the Distribution Function in multiple ways:
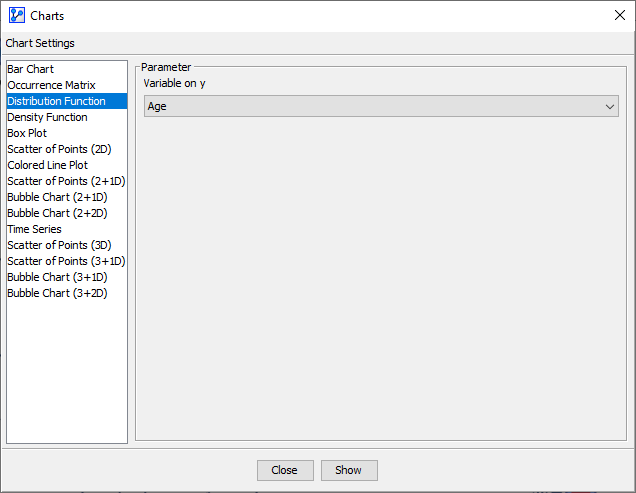
Menus > Data > Charts > Distribution Function.Node Contextual Menu > Charts > Distribution Function.
In the Parameter panel, select the variable to plot from the Variable on y dropdown menu. If you had nodes selected when you opened the Charts window, the variables in the dropdown menu are restricted to that selection. Click Show.
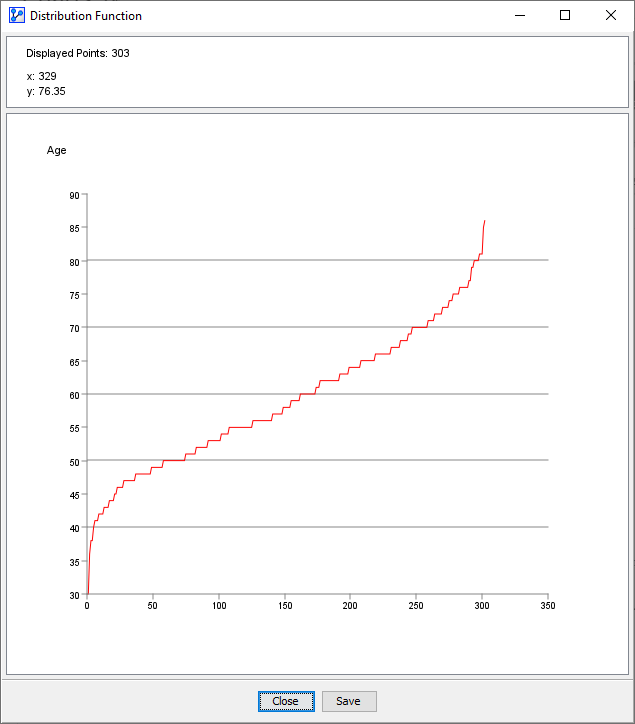
On the x-axis, the observations are ordered according to the corresponding y-values, from smallest to largest. The highest x-value corresponds to the total number of observations. On the y-axis, the values of the variable are plotted.
The horizontal lines on the chart mark the thresholds of the node’s intervals. Note that these thresholds are for reference only and cannot be modified here.
At the top of the chart window, the Information Panel reports the total number of plotted points plus the x and y coordinates of the cursor position.
To zoom in to the chart, click and hold the left mouse button. Drag the cursor to designate the area to focus on. Then, release the mouse button. To revert to the default zoom level, double-click anywhere on the plot.