Distribution
Context
With the Distribution comparison function, you can compare two files containing Log-Loss values, each of which represents the fit of a dataset to a Bayesian network model. In other words, this function compares the measures of fit, not the underlying data itself.
As a result, you can even compare the fit of two entirely unrelated datasets to their respective models, e.g., comparing the data-to-model fit of an image recognition model to the data-to-model fit of a credit risk model. More realistically, you can compare the fit of a Bayesian network model with the fit produced by a different modeling technique.
Usage
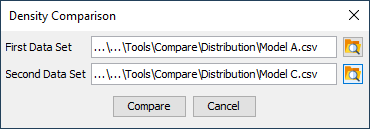
In Validation Mode, select Menus > Tools > Compare > Distribution. Then a pop-up window prompts you to select two files; each must contain Log-Loss values for each record in a dataset.
-
Open the first network, switch into Validation Mode, and then perform
Inference > Batch Joint Probability > (Text File | Database | Internal Data | Internal Evidence Scenarios).Here, it is not necessary to save the values of any nodes, so
No Nodeshould be selected.
When you select the file name, BayesiaLab prompts you to decide whether the logarithm of the joint probability should be saved. For our purposes,
Nomust be selected.
-
Repeat the previous steps for the second network, saving the file under a different name.
-
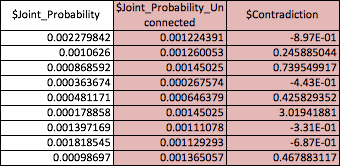
The resulting CSV files each contain three columns. Delete the two rightmost columns (highlighted in red) in each file with a spreadsheet editor.
-
Save the edited files, maintaining the CSV format.
-
Once the files are prepared in this format, you can start the Comparison of Joint Probabilities:
Inference > Batch Joint Probability > (Text File | Database | Internal Data | Internal Evidence Scenarios). -
Select the previously edited files via the dialog box and click
Compare.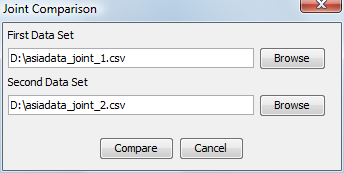
Results
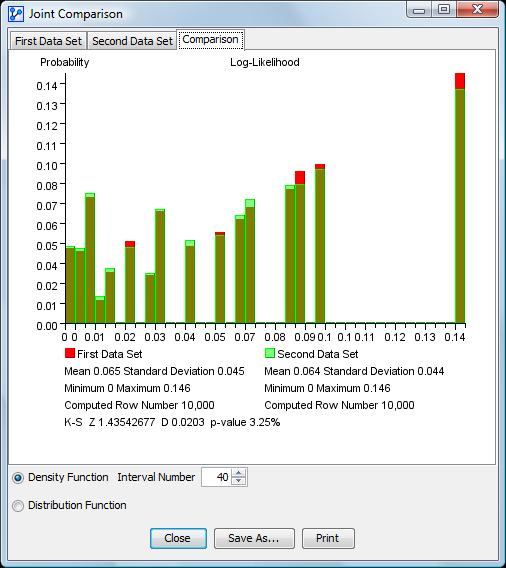
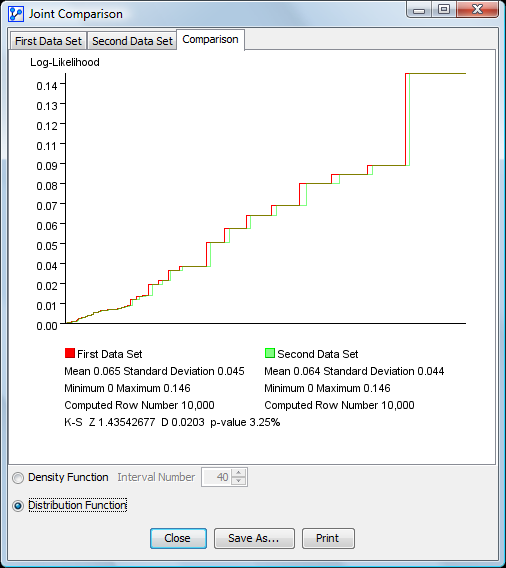
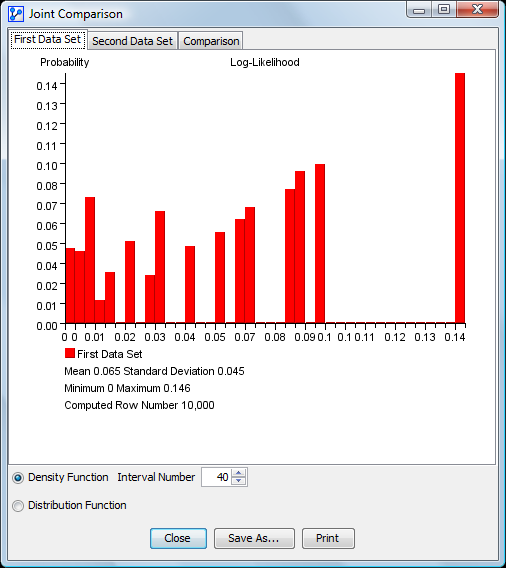
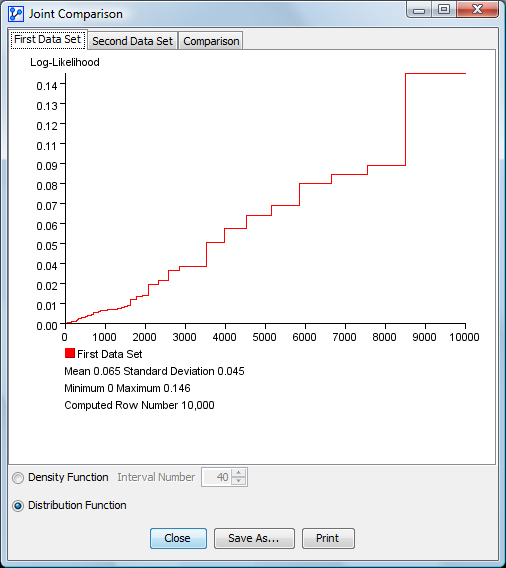
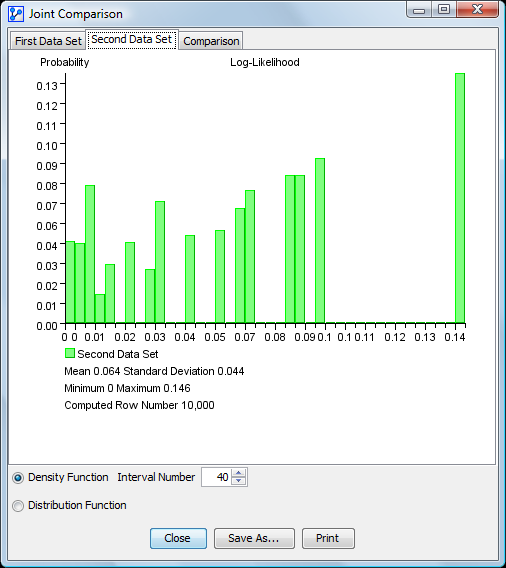
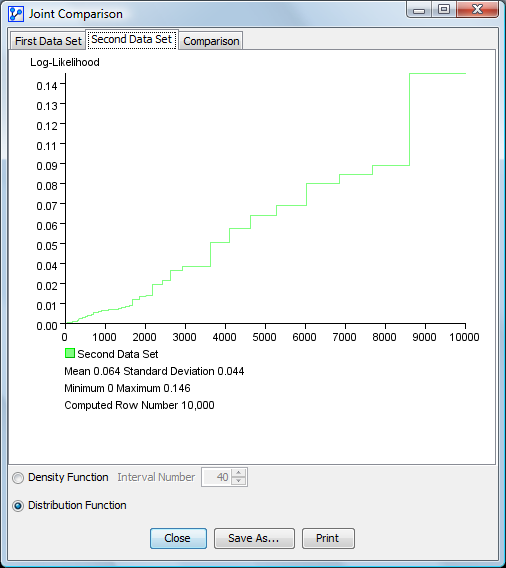
The results are presented in three tabs: First Data Set, Second Data Set, and Comparison.
Each panel shows the mean, standard deviation, minimum, maximum, and computed row numbers.
First Data Set
Second Data Set
Comparison
The Kolmogorov-Smirnov Test is computed to test for the equality of the probability distributions of both datasets.
More specifically, it compares the distributions of log-likelihoods. The panel also reports the K-S Z and D statistics along with their p-value.