Variable Clustering
Context
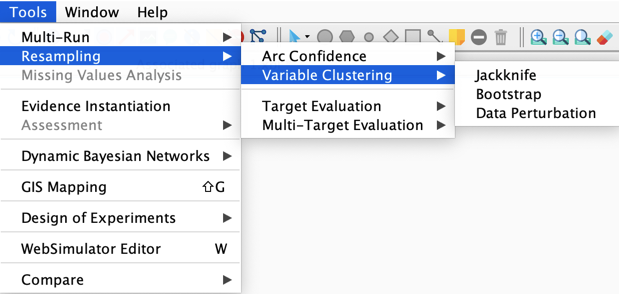
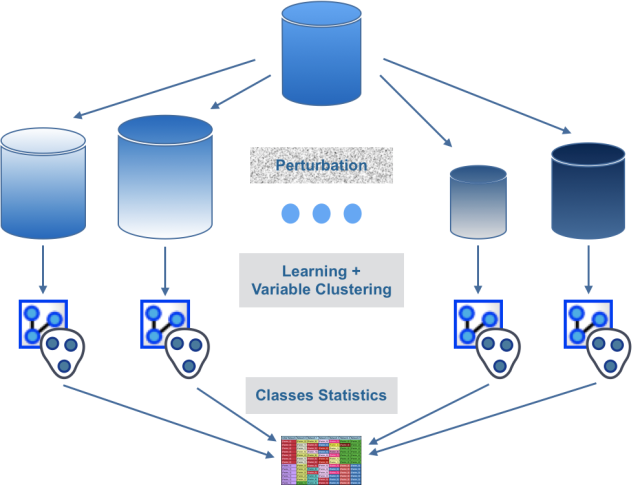
This feature is used to measure the stability of the groups of variables that have been induced with Variable Clustering. Various data sets are generated from the original data set with one of the resampling methods, then Unsupervised Structural Learning and Variable Clustering are run iteratively on each data set, and the obtained clusters are compared with those of the current network.
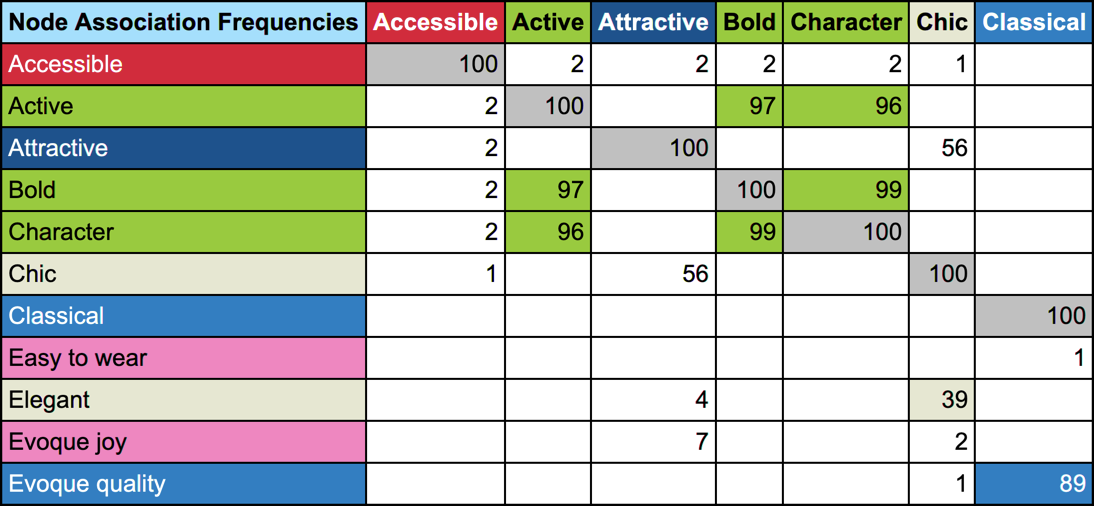
Variable Clustering Report: Node Association Frequencies
The Node Association Frequencies table returned by the Variable Clustering Report is color-coded:
- Grey indicates the diagonal, with the value 100, since a node always belongs in a cluster with itself.
- White indicates that the nodes in the row and column are not Co-Manifest variables, meaning they do not belong to the same cluster in the original network.
- Any other color indicates that the nodes in the row and column are Co-Manifest variables; the color is the one of their cluster in the original network.
Overall and Local Purities
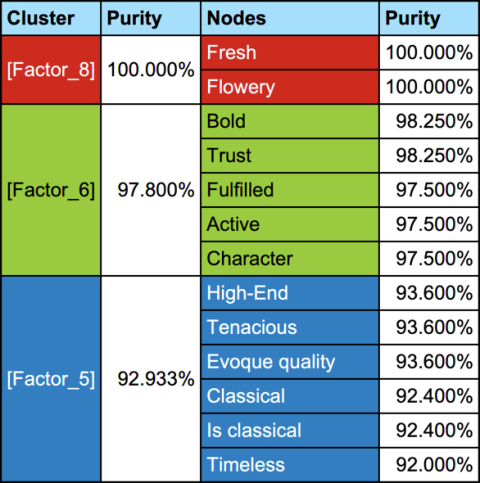
The Variable Clustering Report returns an additional table with purities for each cluster and each node. The purity of a node is the average of the association frequencies with its Co-Manifest variables, and the purity of a cluster is the average of the purity of its associated manifest variables.
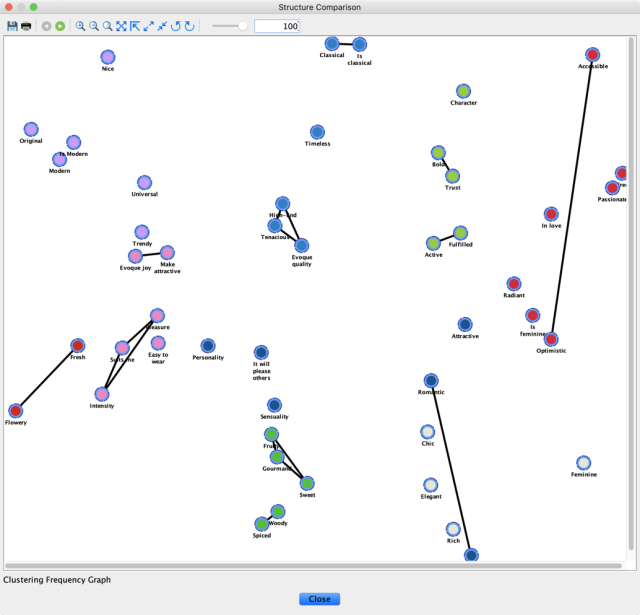
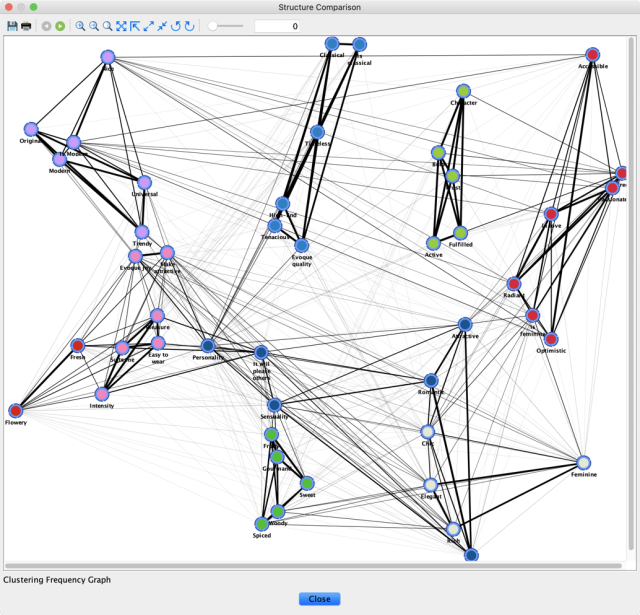
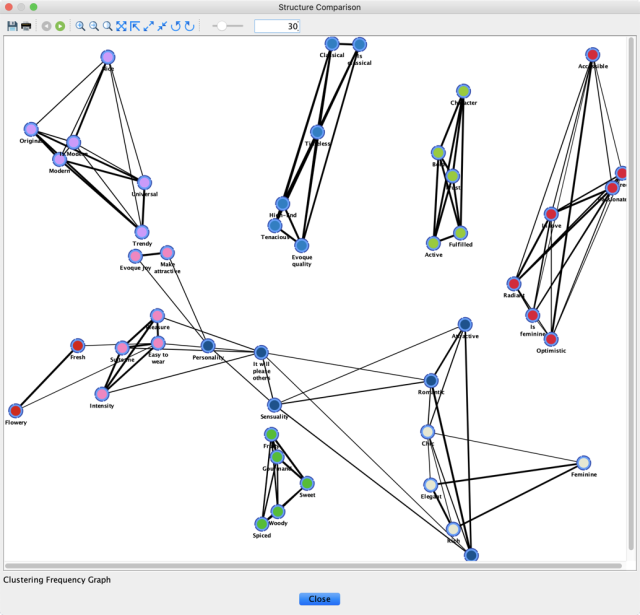
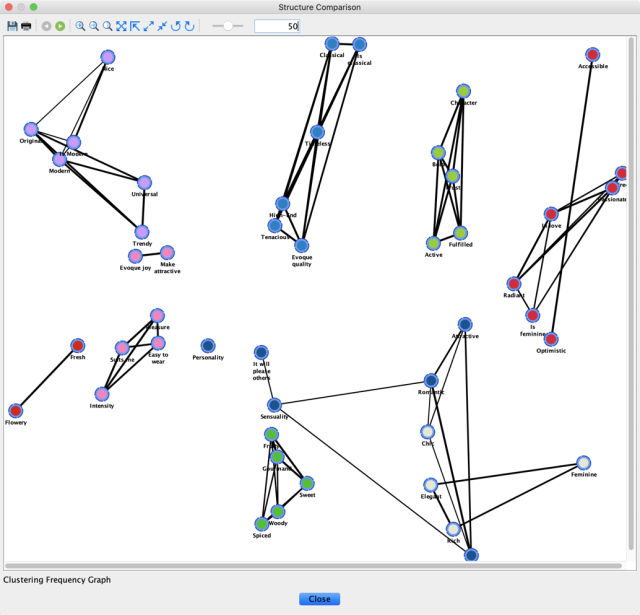
Clustering Frequency Graph: Frequency Filter
The Variable Clustering Graph is equipped with a slider that allows you to hide the connections that are below the defined frequency threshold.
Filter: 0
Filter: 30
Filter: 50
Filter: 70
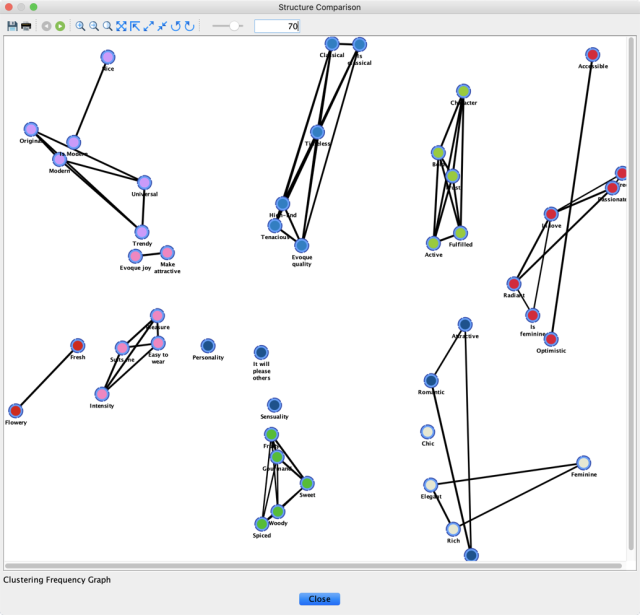
Filter: 100