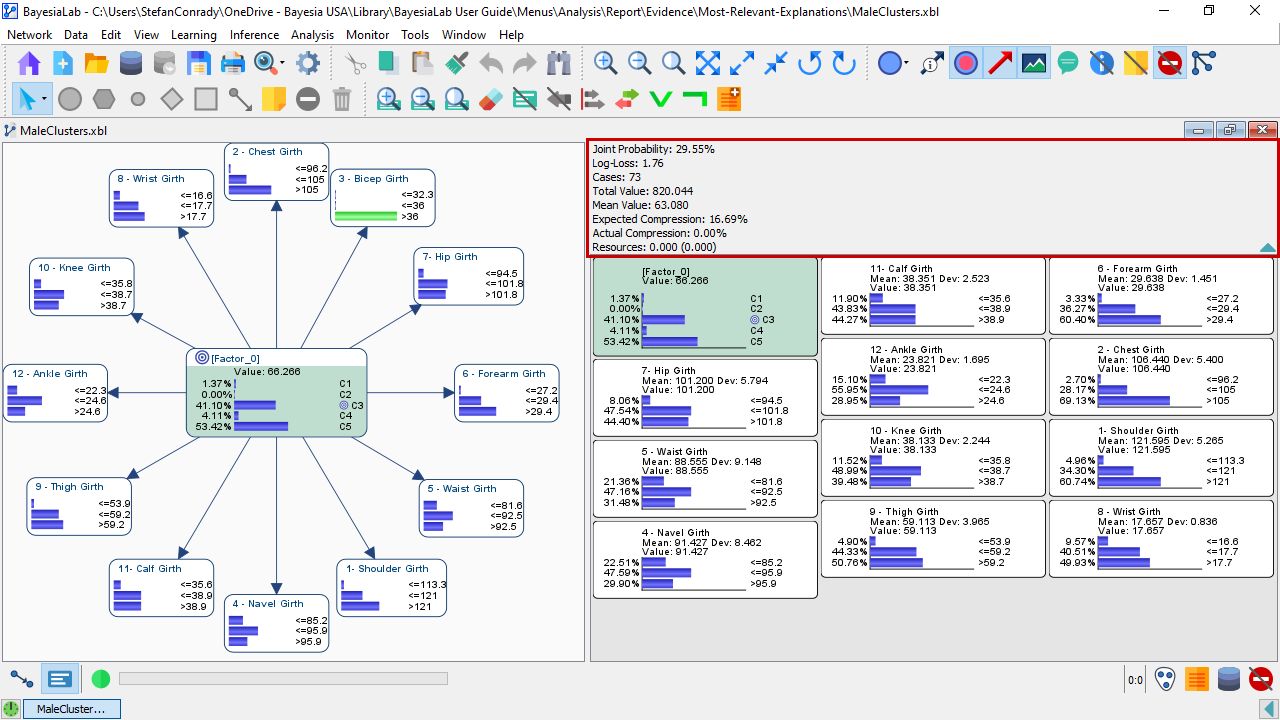
Information Panel
Context
- The Information Panel is positioned at the top of the Monitor Panel.
- The Information Panel features up to eight different statistics.
- It is only visible in Validation Mode.

Usage
- You can open and close the Information Panel with the button located at the top right corner of the Graph Window.
Content
Joint Probability
- The Joint Probability is calculated based on the current set of evidence, e.g., hard positive, hard negative, virtual, soft, and numerical.
- The Joint Probability is also known as the Marginal Likelihood.
- Without any evidence set, the Joint Probability is 100%.
- BayesiaLab updates the Joint Probability automatically with each modification of evidence via the Monitors.
Log-Loss
- Log-Loss is the binary logarithm of the Joint Probability.
- If the Joint Probability equals 100%, the Log-Loss is 0.
- The Log-Loss increases towards infinity as the Joint Probability approaches 0.
- Like the Joint Probability, the Log-Loss is automatically updated with each new piece of evidence.
Cases
- If a dataset is associated with the network, the Information Panel shows an estimate of the number of records that correspond to the current set of evidence.
- If no evidence is set, the number reported by Cases is equal to the total number of records in the associated dataset.
- Whenever evidence is modified via the Monitors, the value of Cases is automatically recomputed.
Total Value
- The Total Value shown in the Information Panel represents the sum of the expected values of all nodes in the network given the current set of evidence.
Mean Value
- The Mean Value shown in the Information Panel represents the arithmetic mean of the expected values of all nodes in the network given the current set of evidence.
Expected Compression
- Expected Compression measures the relative reduction of the sum of the entropies of all unobserved nodes compared to the sum of their prior entropies.
Actual Compression
- Actual Compression measures the relative Information Gain of the current set of evidence, i.e., the Information Gain normalized by the Marginal Likelihood computed with the fully unconnected network.
Resources
- Resources shows the sum of all Utility Nodes.
Display Options
If not shown by default, you can add Compression and Resources to the Information Panel:
- Select
Node Context Menu > Show > Compression. - Select
Node Context Menu > Show > Resources.
You can use Main Menu > Window > Preferences > Display > Monitor Panel to
define what is displayed by default in the Information Panel.
