
Cluster Interpretation: Segment Profile Analysis
Background & Context
On this page, we present the Segment Profile Analysis for cluster interpretation as an alternative to Most Relevant Explanations for Cluster Interpretation.
To provide further context for Most Relevant Explanations for Cluster Interpretation, we compare several other approaches that can help interpret individual Clusters:
- Setting Evidence for Cluster Interpretation: Posterior Distributions, Relationship with Target Node, Mosaic Analysis, Posterior Mean Analysis, Segment Profile Analysis, Histograms, Tornado Diagrams,
- Optimization for Cluster Interpretation: Dynamic Profile, Target Optimization Tree
More specifically, we compare all these approaches with regard to characterizing the state of the Cluster Node in the reference network.
All analyses and instructions on this page refer to this reference network, which you can download here:

Segment Profile Analysis
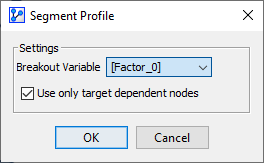
We start the Segment Profile Analysis by selecting Menus > Visual > Segment > Profile. A Settings window opens up, in which we need to specify the Breakout Variable. In our case, we want to see the values of the manifest nodes broken out by the Clusters through .
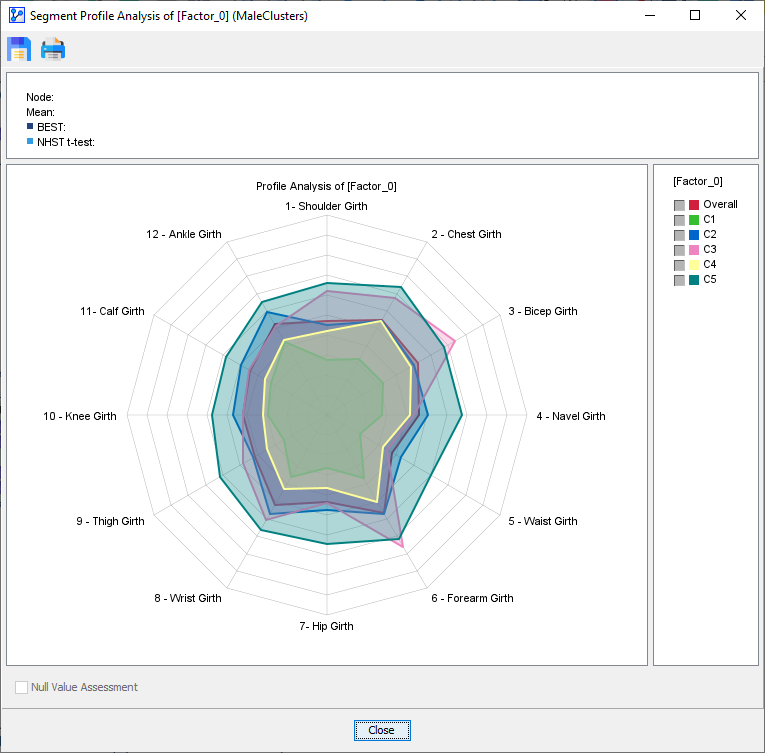
The default view of the Segment Profile Analysis window shows a Radar Chart on which all Clusters are plotted plus the population mean for reference.
Given our interest in , we select to display versus Overall. Additionally, we sort the nodes in increasing order according to their delta between and Overall.
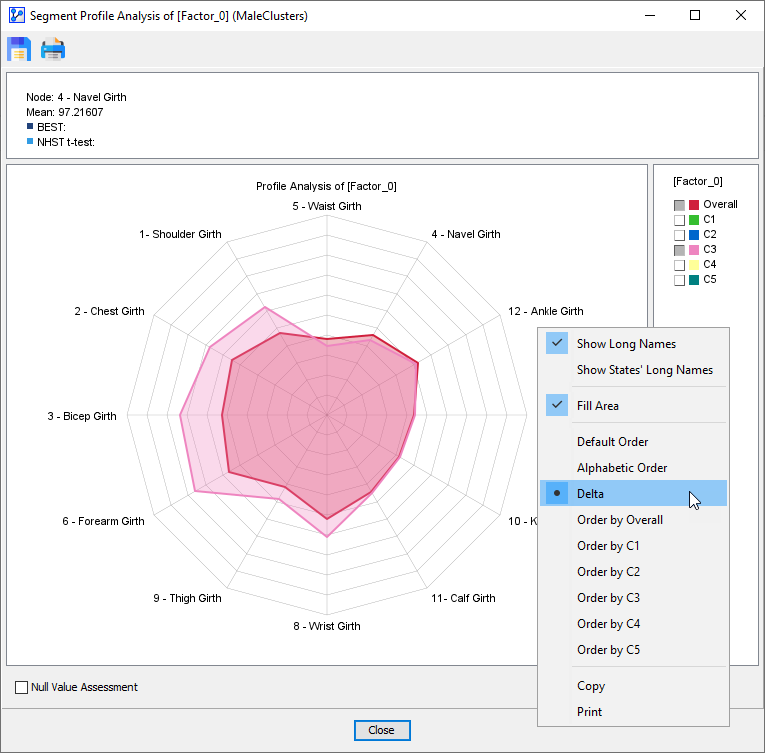
This shows how Cluster members start below-average at 12 o’clock, remain around the average between 2 and 5 o’clock, and then stay well above average starting at 6 o’clock.
Additionally, by checking Null Value Assessment, BayesiaLab performs significance testing.
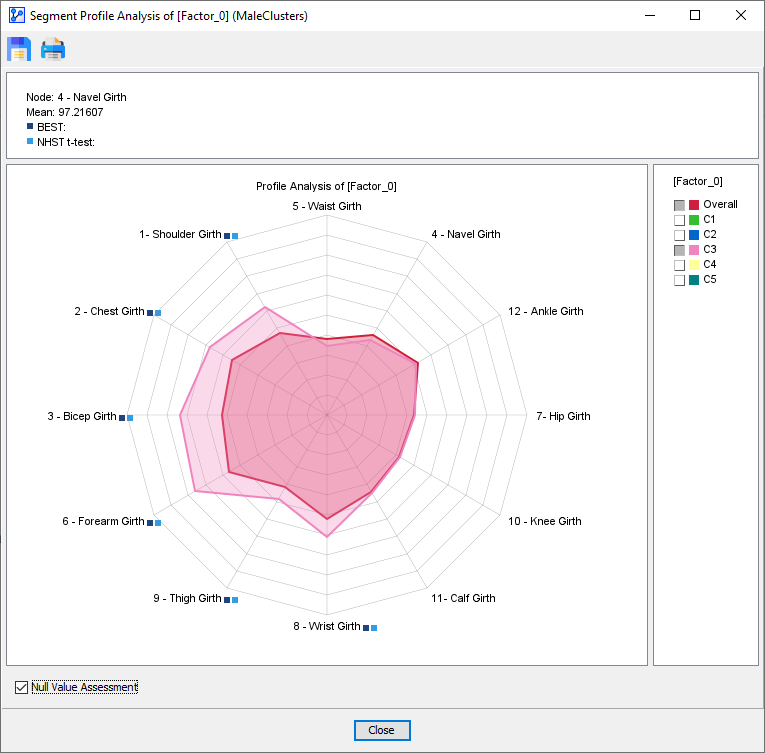
Small blue squares are added to the node names if the Null Hypothesis is rejected for the difference between mean values:
- NHST t-test, a type of frequentist test.
- BEST, a Bayesian test.
Note that significance testing is only available when two curves are selected. For further details on these significance tests, please see Segment Profile Analysis.