Cluster Interpretation: Target Optimization Tree
Background & Context
On this page, we present the Target Optimization Tree for cluster interpretation as an alternative to Most Relevant Explanations for Cluster Interpretation.
To provide further context for Most Relevant Explanations for Cluster Interpretation, we compare several other approaches that can help interpret individual Clusters:
- Setting Evidence for Cluster Interpretation: Posterior Distributions, Relationship with Target Node, Mosaic Analysis, Posterior Mean Analysis, Segment Profile Analysis, Histograms, Tornado Diagrams,
- Optimization for Cluster Interpretation: Dynamic Profile, Target Optimization Tree
More specifically, we compare all these approaches with regard to characterizing the state of the Cluster Node in the reference network.
All analyses and instructions on this page refer to this reference network, which you can download here:

Target Optimization Tree for Cluster Interpretation
In addition to the optimization approach shown on the previous page for the Dynamic Profile, we now consider the Target Optimization Tree. With Dynamic Profile, we obtained the “single fastest” way for a subject to get into . However, the resulting profile may provide an idealized and, therefore, limited portrait of a man. Instead, we now want to create several sketches of subjects that are, for practical purposes, an equally good fit for .
To start the Target Optimization Tree, select Menus > Analysis > Target Optimization > Tree. As with the Dynamic Profile, we need to specify the Target State as in the Target Optimization Tree Settings:
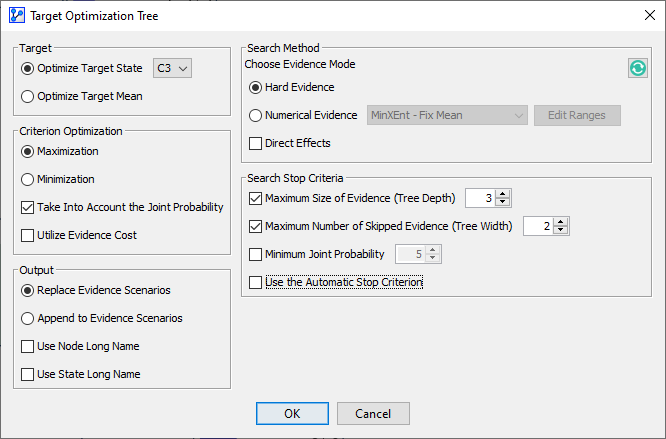
Upon confirming the settings with OK, BayesiaLab produces the following Optimization Tree, which is shown outside its window for visual clarity:
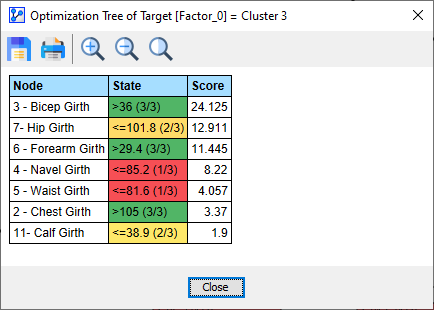
This tree highlights multiple pathways to “get into” with an 85% or higher probability. So, proceeding from the top, through any of the branches to any of the endpoints at the bottom, assembles the characteristics of a prototypical man. In other words, each path provides a useful sketch.
To conclude, BayesiaLab offers a report that summarizes the weights of all these sketches. Clicking the Report button at the bottom of the Optimization Tree window brings up the Report window: