
Cluster Interpretation: Dynamic Profile
Background & Context
On this page, we present the Dynamic Profile for cluster interpretation as an alternative to Most Relevant Explanations for Cluster Interpretation.
To provide further context for Most Relevant Explanations for Cluster Interpretation, we compare several other approaches that can help interpret individual Clusters:
- Setting Evidence for Cluster Interpretation: Posterior Distributions, Relationship with Target Node, Mosaic Analysis, Posterior Mean Analysis, Segment Profile Analysis, Histograms, Tornado Diagrams
- Optimization for Cluster Interpretation: Dynamic Profile, Target Optimization Tree
More specifically, we compare all these approaches with regard to characterizing the state of the Cluster Node in the reference network.
All analyses and instructions on this page refer to this reference network, which you can download here:

Dynamic Profile for Cluster Interpretation
We can use BayesiaLab’s optimization tools to work with more complex sets of evidence. One of these optimization tools is the Dynamic Profile. The Dynamic Profile uses a greedy search algorithm to simulate sets of evidence that maximize the probability of . It may seem counterintuitive to think of optimizing evidence to achieve membership in . After all, we cannot modify body measurements. However, we can think of those characteristics that assign a subject to most quickly as prototypical traits of .
To start Dynamic Profile, select Menus > Analysis > Target Optimization > Dynamic Profile. In the Dynamic Profile Settings, we need to specify that we want to maximize the probability of by searching across Hard Evidence.
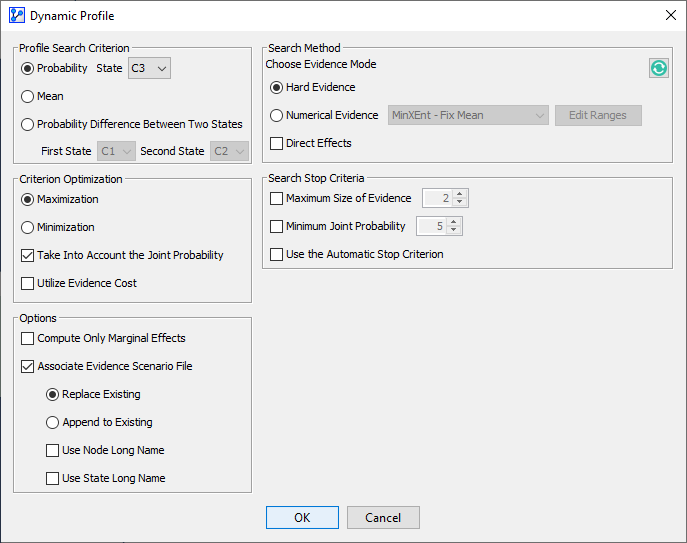
Clicking OK starts the search and quickly produces a solutions table, which opens in a new window:
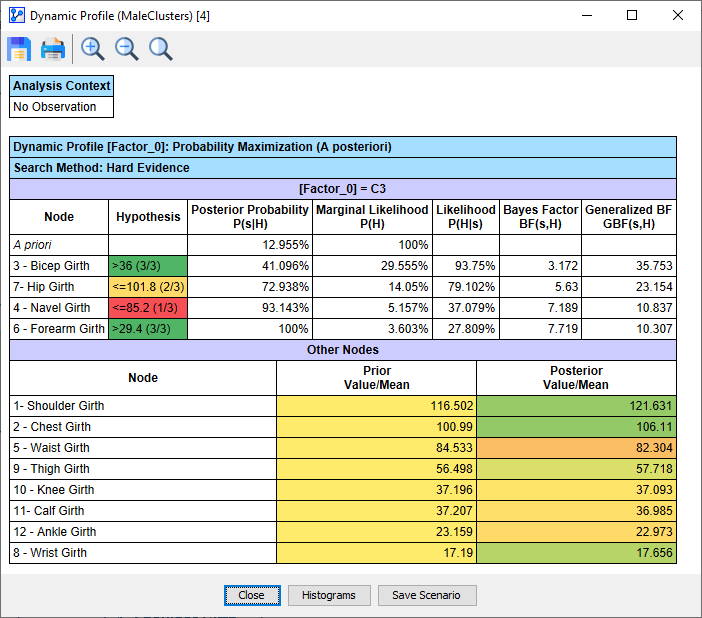
The starting point is the row in the table marked A priori, which shows that , i.e., the marginal probability of . If we evaluate the hypothesis , the posterior probability increases, i.e., . In this case, the Bayes Factor is 3.172, meaning that with this hypothesis, membership is 3.172 times more probable than without it. Setting , the probability of membership increases further to 72.938%. With and , we reach a probability of 100%.
As a result, we can interpret this set of evidence as a prototypical profile for a subject in :