
Cluster Interpretation: Posterior Mean Analysis
Background & Context
On this page, we present the Posterior Mean Analysis for cluster interpretation as an alternative to Most Relevant Explanations for Cluster Interpretation.
To provide further context for Most Relevant Explanations for Cluster Interpretation, we compare several other approaches that can help interpret individual Clusters:
- Setting Evidence for Cluster Interpretation: Posterior Distributions, Relationship with Target Node, Mosaic Analysis, Posterior Mean Analysis, Segment Profile Analysis, Histograms, Tornado Diagrams,
- Optimization for Cluster Interpretation: Dynamic Profile, Target Optimization Tree
More specifically, we compare all these approaches with regard to characterizing the state of the Cluster Node in the reference network.
All analyses and instructions on this page refer to this reference network, which you can download here:

Posterior Mean Analysis
Given that all manifest nodes feature numerical values, the Posterior Mean Analysis lends itself to interpreting the Clusters. To start the Posterior Mean Analysis, select Menus > Analysis > Report > Target > Posterior Mean Analysis.
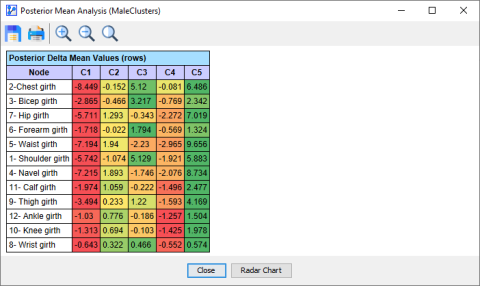
The above screenshot shows the report section in which the Posterior Delta Mean Values are displayed. This means that values are displayed as a difference from the population mean for each row. Furthermore, the values are color-coded: Red marks the lowest value in each row, and green marks the highest. Values close to the row mean value are highlighted in yellow.
This enables quick visual interpretation. Individuals in Cluster are on the bottom end of the range for most measurements, while members of seem to have consistently high values. Looking at Cluster , we observe a contrast: high values for upper body measurements, but only below-average values for lower body measures.
Radar Chart
Clicking the Radar Chart button at the bottom of the Posterior Mean Analysis Report window opens a new window. The Radar Chart provides another way of visually interpreting the Cluster differences.
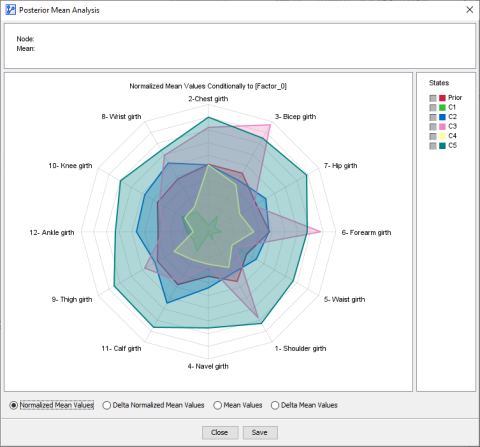
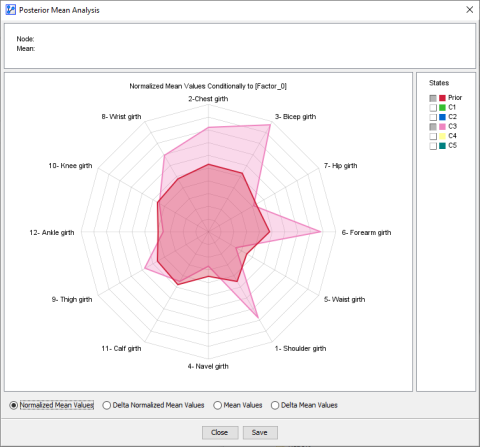
To compare specific Clusters, we can focus on a subset, such as and the Prior Values (Mean Values).
To focus on differences, we can also change the sort order of the variables. Here, we order the nodes according to the difference between the Prior and Cluster .
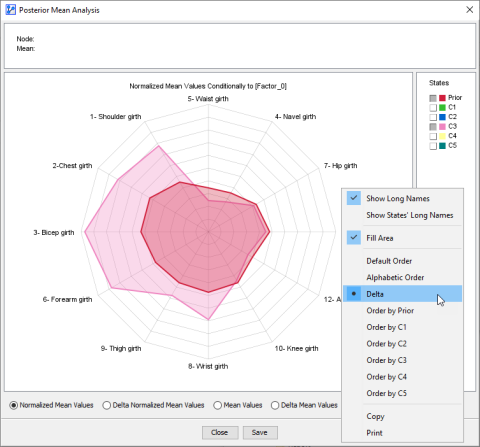
This view highlights the strength of members in terms of the upper body and the below-average values for the lower torso and the lower extremities.