
Automatic Propositional Causal Bayesian Network Generator
Overview
The Automatic Propositional Causal Bayesian Network Generator builds a fully specified Propositional Causal Bayesian Network entirely from the knowledge encoded in Large Language Models, without requiring you to supply any nodes beforehand. It extracts both the nodes (which are Boolean propositions) and the signed causal relations between them, then writes the Conditional Probability Tables using either the DualNoisyOr() or SwitchNoisyOr() function (configurable under Preferences > Tools > Hellixia).
The result is a network in which:
- Every node represents a proposition, i.e., a statement that is either or .
- Every arc carries a signed direct effect ranging from -1 (inhibiting, shown in red) to +1 (promoting, shown in blue).
- The Conditional Probability Tables are generated automatically from the chosen
DualNoisyOr()orSwitchNoisyOr()function.
This generator is the causal counterpart of the Knowledge Graph Generator and follows the same “generator” pattern: it creates both nodes and relations from scratch. This is in contrast to the “finder” pattern of the Causal Relationship Finder, which only detects relations among nodes you have already supplied.
Workflow
To begin, select Menus > Hellixia > Automatic Propositional Causal Bayesian Network Generator.
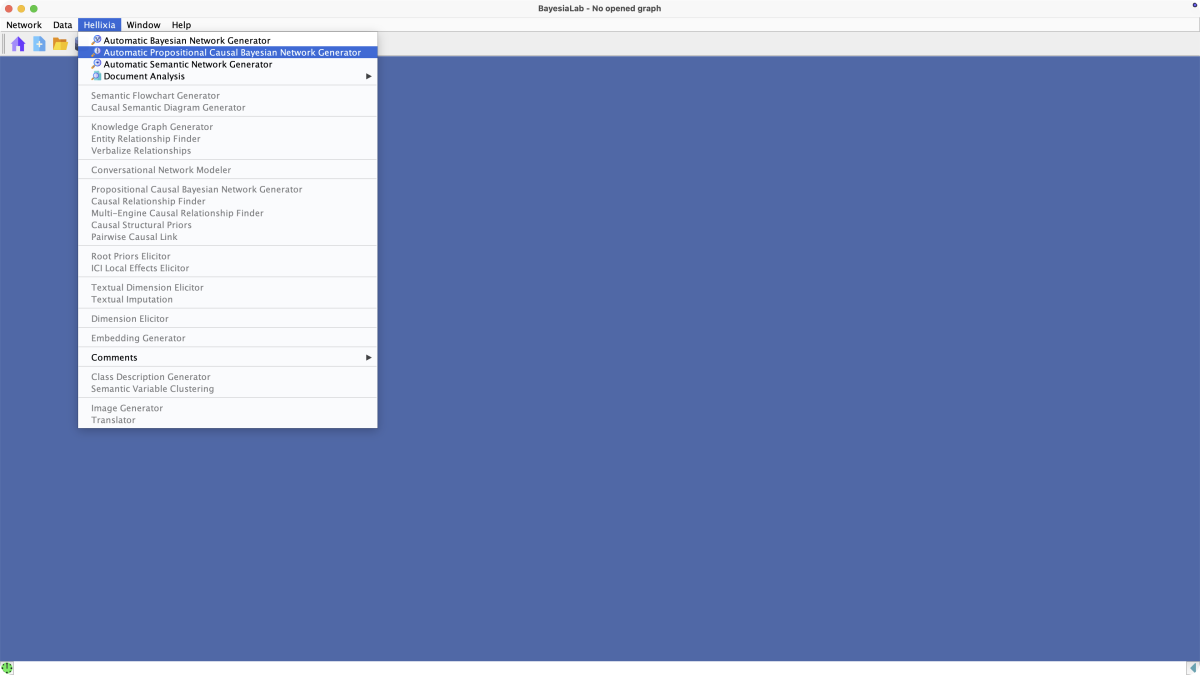
A window opens up and prompts you for the topic of the Bayesian network to be modeled: What would you like to model today?
The topic you provide can be as simple as a single concept, e.g., “Lung Cancer”, or a longer description.
If you don’t check the Advanced Mode, you can immediately kick off the network generation process by clicking OK.
If you do check the Advanced Mode, the Settings panel provides you with a range of options.
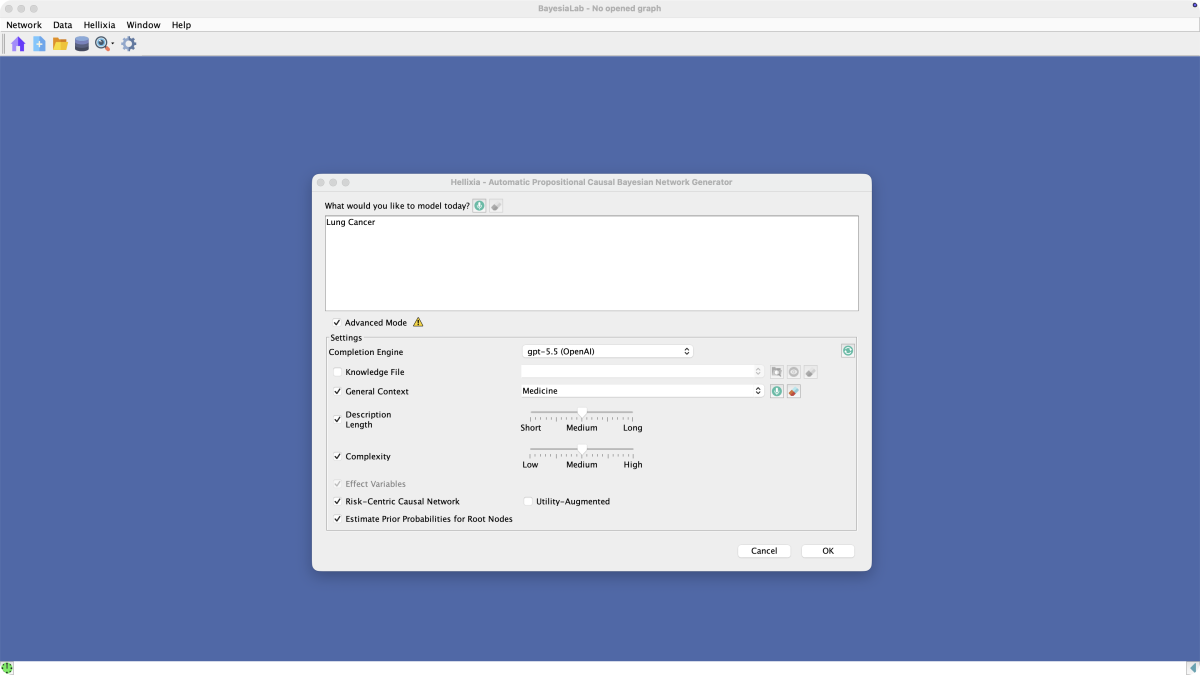
As with all “network generator” functions in Hellixia, you can choose the Completion Engine.
The optional Knowledge File allows you to introduce very specific resources on the particular topic to be studied.
Under General Context you can also provide helpful guidance to the model development, especially if the topic you provide is ambiguous. Given the topic of Lung Cancer, the medical context is fairly obvious, but it is good practice to provide a General Context to avoid any ambiguities.
Description Length refers to the literal length of the node (concept) descriptions to be generated.
The term “Description Length” used here must not be confused with the information-theoretic concept Description Length, which is used extensively throughout BayesiaLab.
Complexity provides directional guidance for how many causes and causes of causes should be included in the network.
The Risk-Centric Causal Network option is especially important.
- With it unchecked, nodes will take on the roles of Root Cause, Intermediate Cause, Intervention, Confounder, Main Criterion, and Effect
- With
Risk-Centric Causal Networkchecked, the nodes take on risk-management roles, such as Threat, Preventive Barrier, Sub-Risk, Main Risk, Consequence, and Mitigating Barrier.
Checking Estimate Prior Probabilities for Root Nodes will prompt the generator to retrieve estimates for the marginal probabilities from the LLM. These probabilities often characterize prevailing risk factors, such as the share of smokers in the population.
Upon completion of the generation process, you will see a network with the Target Node, i.e., at the center.
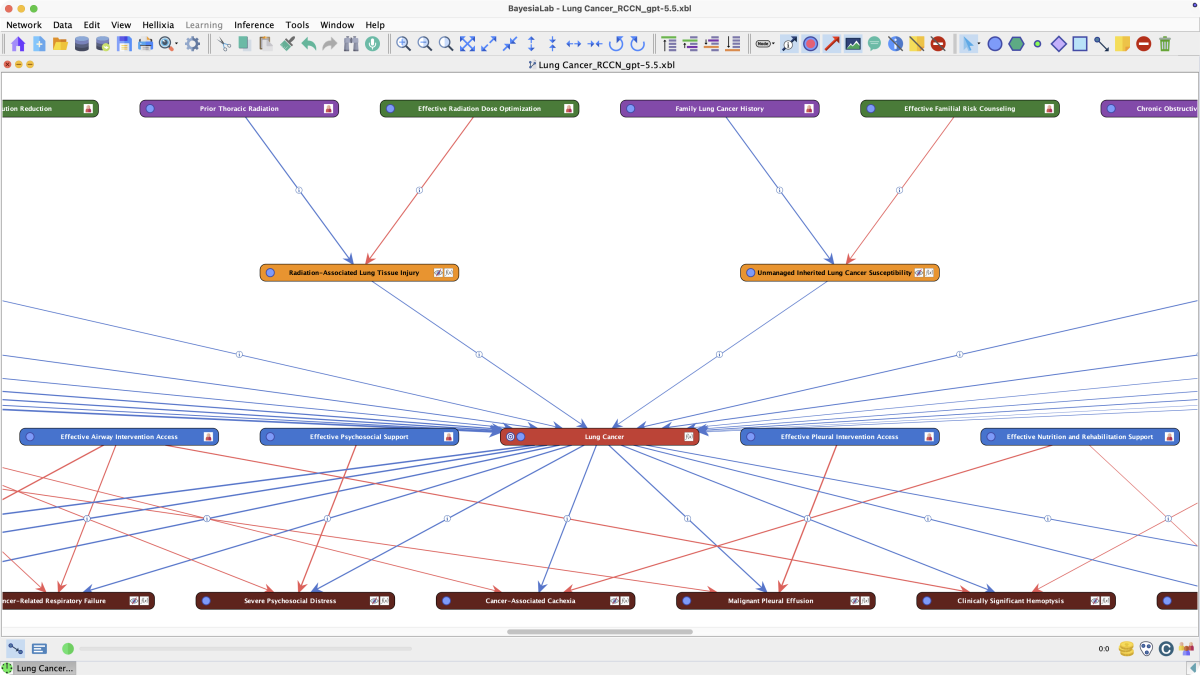
Causes point toward the node from above, and outgoing arcs point toward its effects, positioned below in the network.
By clicking the Arc Comments icon in the Toolbar, you can turn the comment boxes on the arcs on and off.
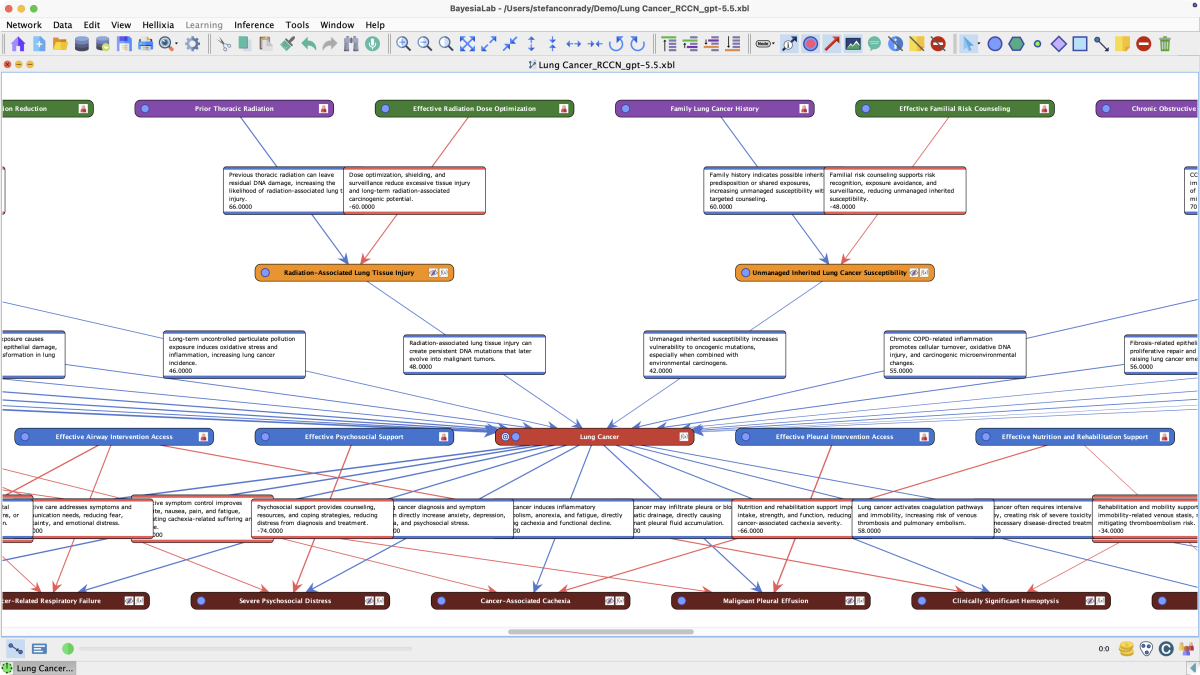
Depending on the zoom level, the Arc Comments may overlap and make them hard to read. To address that, select Menus > View > Automatic Comment Layout.
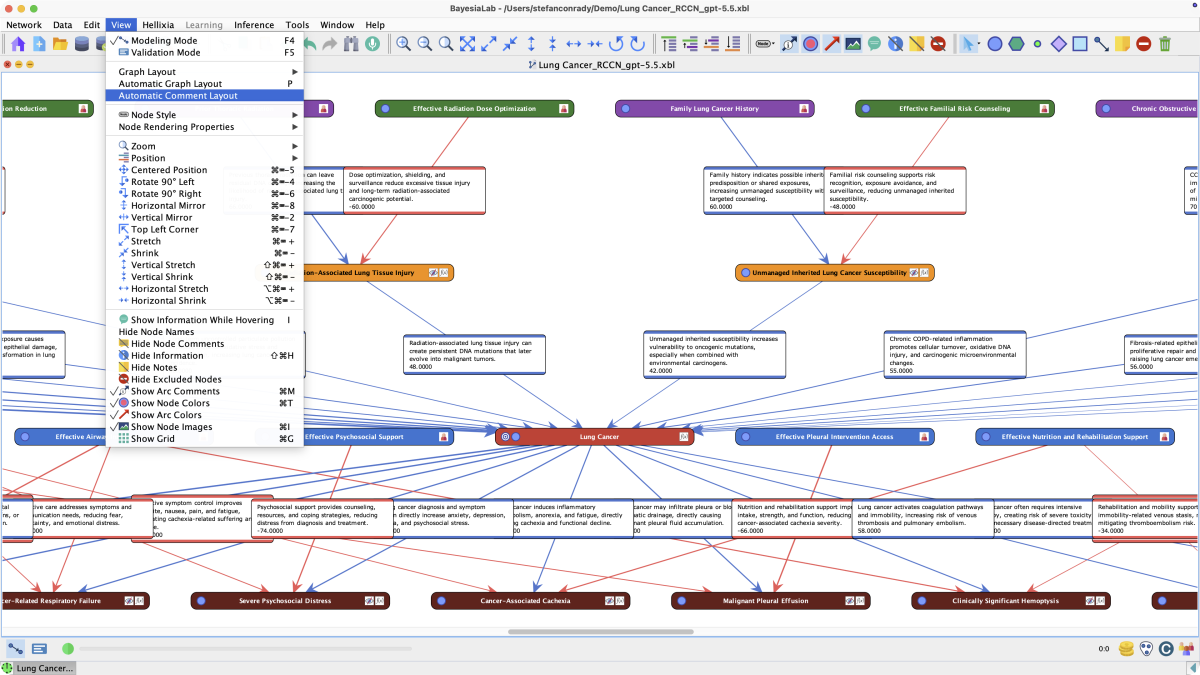
Depending on the size of the network, the layout process may take a short while, but then the position of the Arc Comments will make it much easier to read them in full.
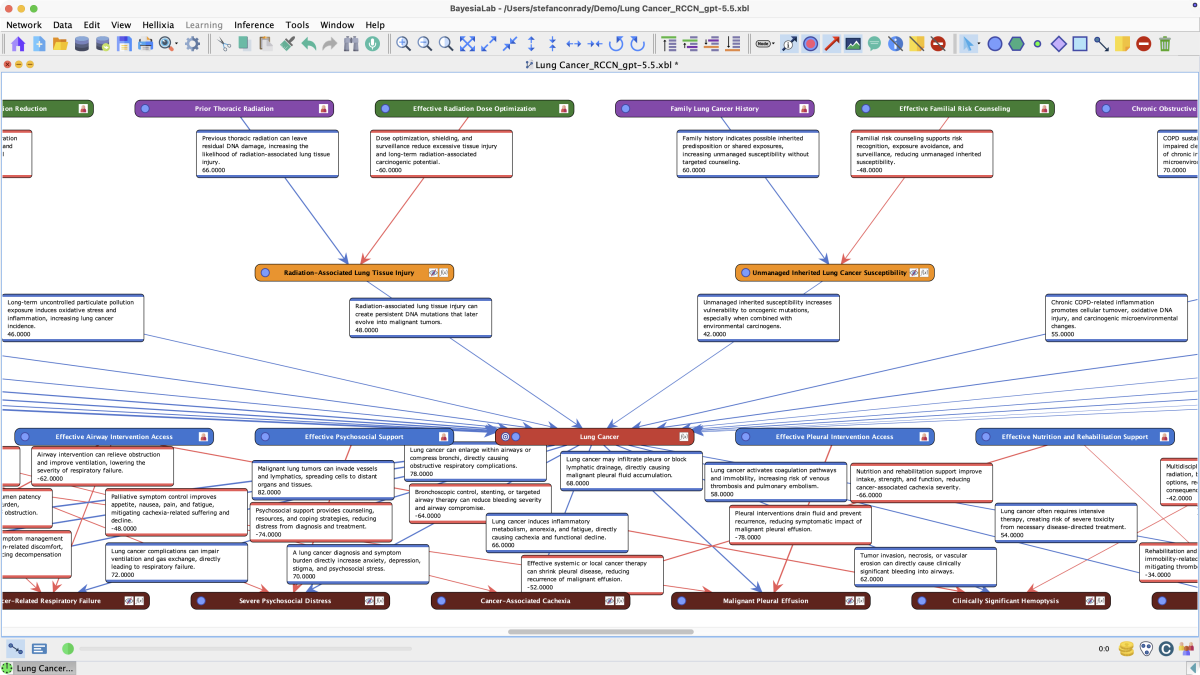
Furthermore, you can show the Node Comments by highlighting the nodes of interest and then selecting Node Contextual Menu > Properties > Rendering Properties > Show Comment.
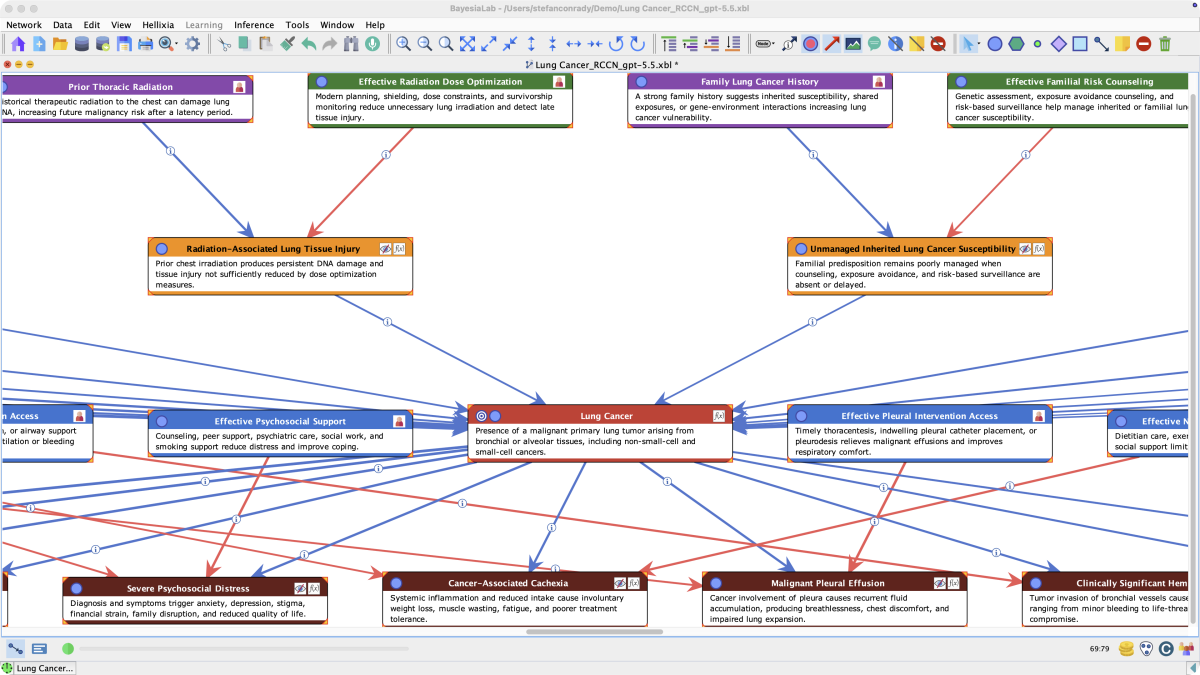
Zooming in on a specific part of the network allows you to learn more about the nodes and their relationships.
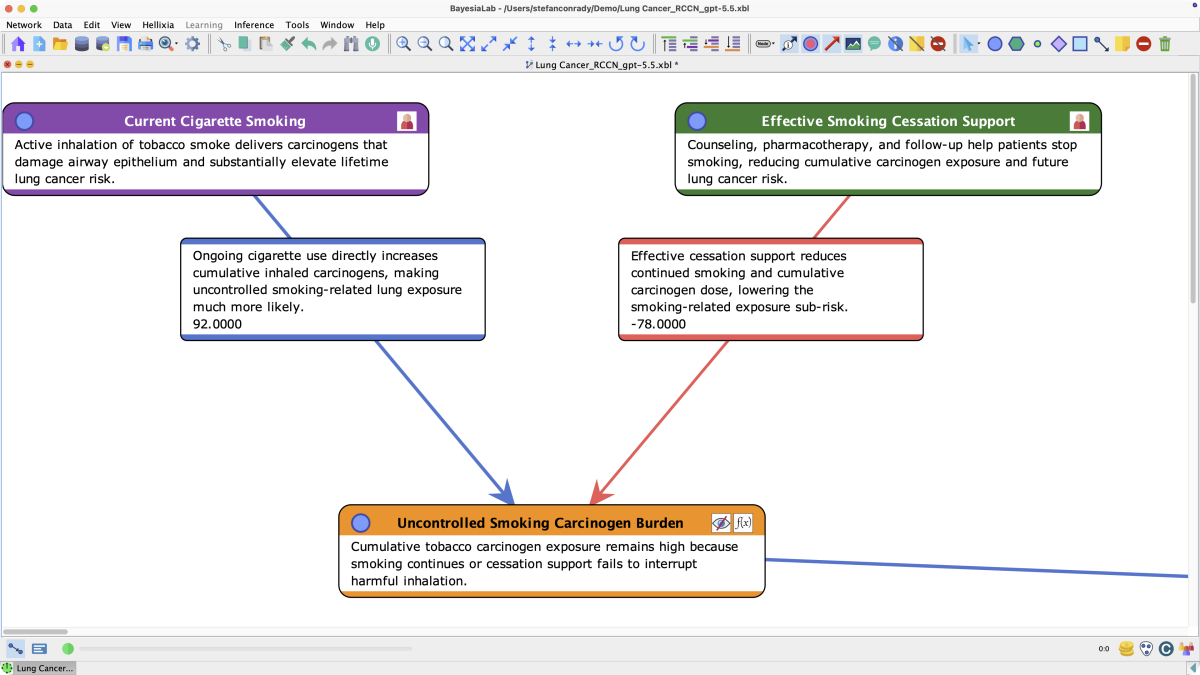
With the close-up view of this subgraph, we can point out several important features of the generated network.
-
The icon on a node, such as on the node , indicates that the probabilities for the states of the node were retrieved from the LLM.
-
Opening the Node Editor of the node reveals the probabilities obtained, i.e., .
Loading SVG...
Note that these values are exclusively generated by querying the LLM through Hellixia. This differs from Parameter Estimation, which could be used if data were available.
On the node , which is the common effect of two causes, namely and , we can see two different icons. The icon means that the Conditional Probability Table of this node was calculated as a function of the distributions of its parent nodes and a formula. How the parent nodes enter the child node is shown at the bottom of the Arc Comments, where numerical values (ranging from -100 to 100) show the sign and the strength of their effects. The values are 92 for the parent node and -78 for .
Similar to the marginal values of the root nodes, these effects were obtained from the LLM. We can see how these values determine the distribution of by opening its Node Editor. Select Node Contextual Menu > Edit to open the Node Editor and then go to the tab Probability Distribution > Formula.
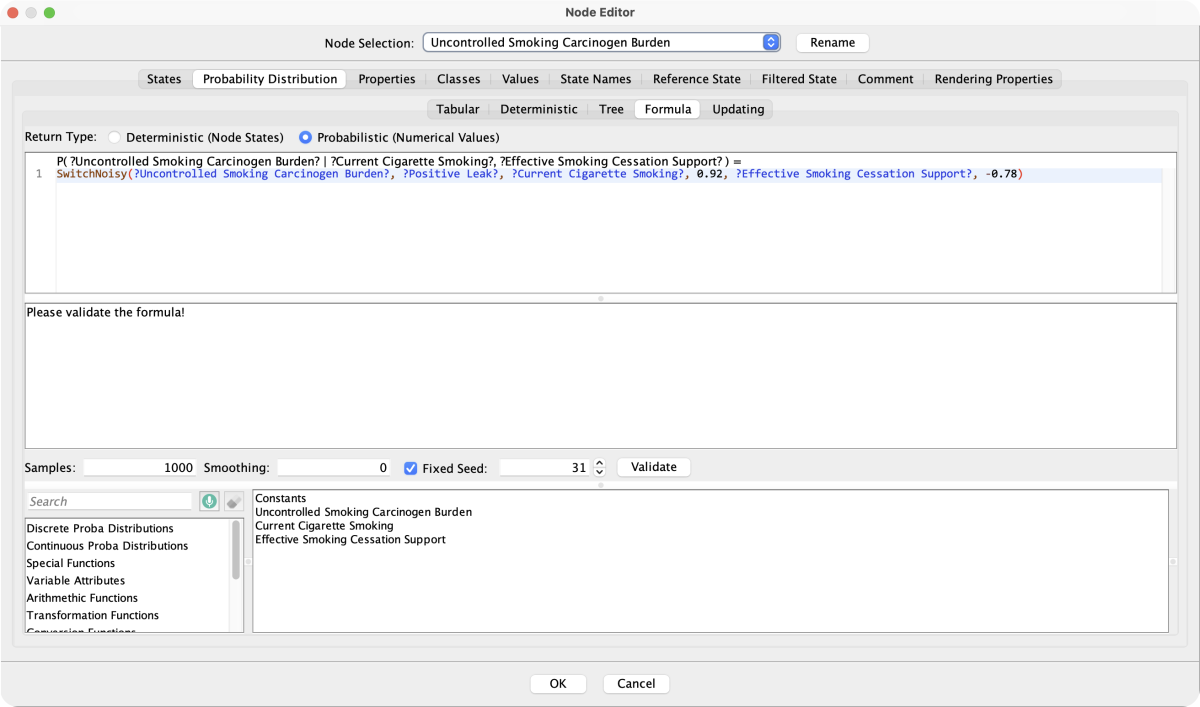
The checkbox indicates that the formula in the Node Editor has a Return Type of Probabilistic. Using the BayesiaLab syntax, the entire formula reads:
P(?Uncontrolled Smoking Carcinogen Burden? | ?Current Cigarette Smoking?, ?Effective Smoking Cessation Support?)= SwitchNoisy(?Uncontrolled Smoking Carcinogen Burden?, ?Positive Leak?, ?Current Cigarette Smoking?, 0.92, ?Effective Smoking Cessation Support?, -0.78)
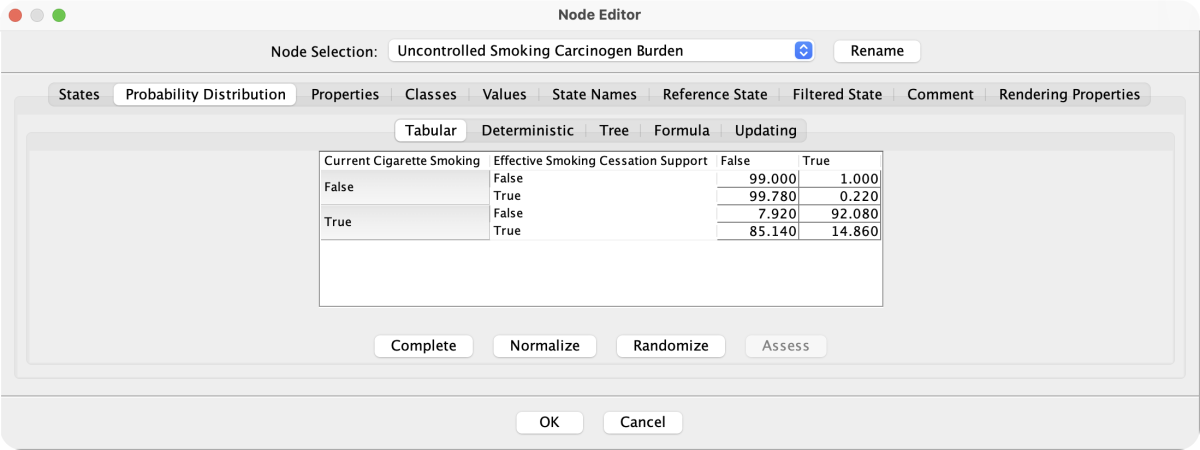
In words, the carcinogen burden is calculated as a function of smoking and cessation. Smoking increases the burden, cessation reduces the burden, and both influences interact. As a result, we have a 2 x 2 matrix that assigns the probability .
| = | = | |
|---|---|---|
This matrix defines the bottom part of the Conditional Probability Table for the node .
You can find this table under Node Contextual Menu > Edit > Probability Distribution > Tabular.
There is another icon on the node , which indicates that the node is not observable: . This means that this is a latent variable, i.e., an intermediate concept introduced into this model to “summarize” certain causes and mitigators of the risk of .
As a result, represents the joint force going into .
In addition to , has many additional causes. The following image shows an extract of the network that shows the immediate causes of .
Related Resources
The Causal Bayesian Network shown above is available for download as an XBL file.

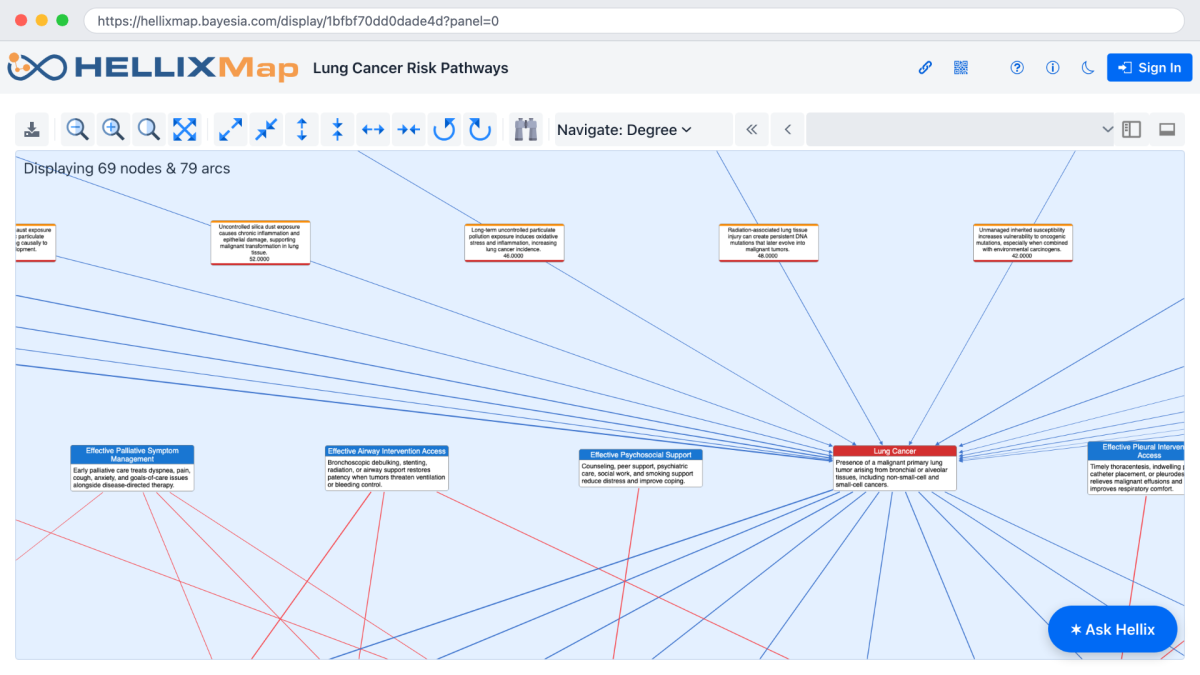
Alternatively, you can open this Causal Bayesian Network for further study on HellixMap.
Related Functions
- Automatic Semantic Network Generator
- Propositional Causal Bayesian Network Generator
- Causal Structural Priors