Bar Chart
Context
- The Bar Chart function within the Charts window visualizes the frequencies of a node’s discrete states in the form of bars.
Usage
- You can access the Bar Chart function in multiple ways:
Main Menu > Data > Charts > Bar Chart.Node Context Menu > Charts > Bar Chart.
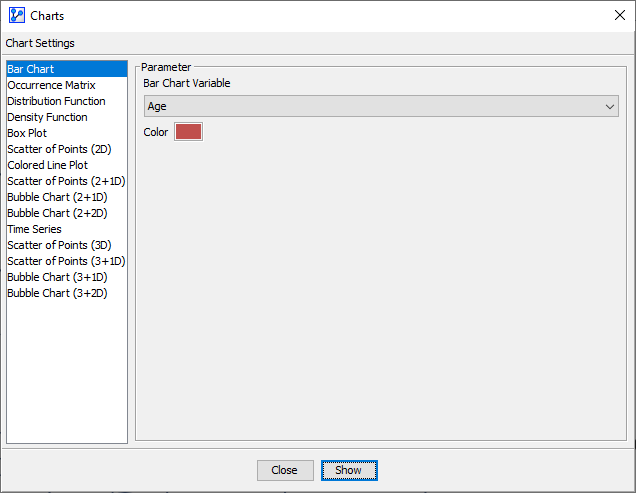
- In the Parameter panel, select any available variable from the
Bar Chart Variabledropdown list.- If you had nodes selected when you opened the Charts window, the variables in the dropdown menus are restricted to that selection.
- Click on the
Colorfield to select the color of the bars. - Click
Showto generate the chart.
- As you move your cursor over the chart, the
Information Panelat the top of the window displays the current state and its value, i.e., the frequency of that state in the dataset. - The
Information Panelalso reports the total number of observations used to generate the chart.