Table View
Context
To illustrate the Node Editor functions for Continuous Nodes, we use the node Sale Price from the Ames dataset, which we explain in detail in Chapter 5 of our e-book.
The node represents transaction prices of residential homes in the city of Ames, Iowa, i.e., the node does have an associated dataset.
Usage
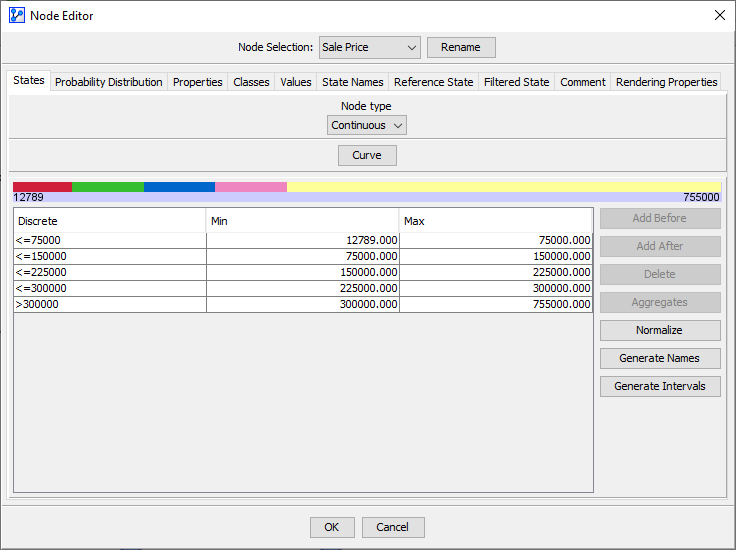
By default, the Node Editor shows a Table View of the node’s intervals.
- The
Discretecolumn displays the State Names associated with each interval. The State Names typically reflect the thresholds of the intervals. However, you can assign any arbitrary names to identify the intervals. - The
Mincolumn shows the lower boundary of each state. - The
Maxcolumn shows the upper boundary of each state.

- The entire table can be edited, so you can modify State Names and intervals. Simply click into the cell of the table to overwrite the existing values.
- However, the upper and lower boundaries of a state must match the lower and upper boundaries of the adjacent states, respectively. This ensures that there are neither gaps nor overlaps in the intervals.
Interval Bar
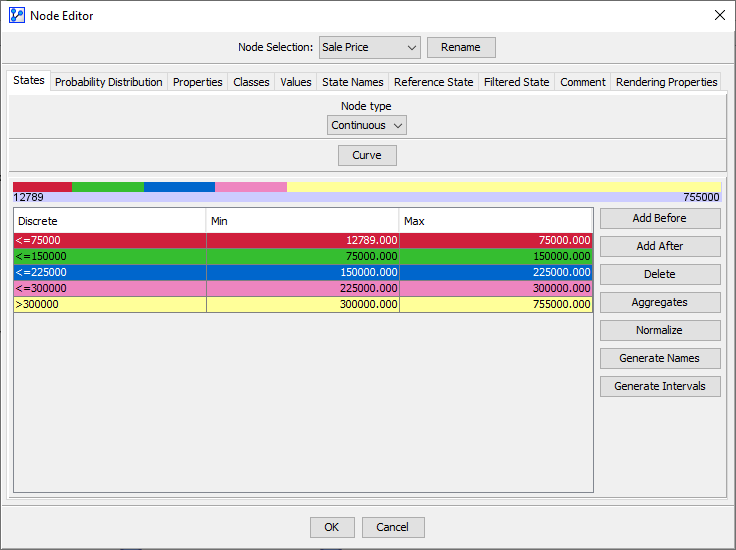
- By clicking into the table, the selected row takes on the color of the corresponding segment in the Interval Bar right above it.
- The following composite screenshot shows all rows in the table highlighted simultaneously to emphasize their correspondence to the segments in the Interval Bar. The length of each segment is proportional to the width of each interval.

- The Interval Bar also allows you to modify the interval by clicking on the segment boundaries and dragging them to the desired position.
Adding Intervals
- Clicking the
Add BeforeandAdd Afterbuttons create a new state above or below the currently selected state. - Note that you must select a state for the
Add BeforeandAdd Afterbuttons to become available. Otherwise, they are grayed out. - Adding a state will take the interval of the selected state and split it evenly between the original and the new state.
Deleting Intervals
Clicking Delete removes the selected interval and adjusts the intervals of the remaining states:
- If you select a state at the top of the list to be deleted, BayesiaLab merges the selected state with the state right below it. The new state will have the lower boundary of the deleted state and the upper boundary of the state below.
- If you select a state at the bottom of the list to be deleted, BayesiaLab merges the selected state with the state right above it. The new state will have the upper boundary of the deleted state and the lower boundary of the state above.
- If you select any other state to be deleted, the midpoint of the deleted state becomes the new lower and upper boundary of the state below and above it, respectively.
Normalize
Clicking Normalize computes thresholds that produce intervals of equal width based on the given number of states.
Generate Names
By clicking Generate Names, you can create State Names that reflect the current boundaries of the states. This is very practical, for example, after you made numerous modifications to the table and wish to update the State Names accordingly.
Generate Intervals
- Using the
Generate Intervalsfunction, you can specify the number of new intervals to be created and a correspondingMinimumandMaximum. - If a dataset is associated, the default
MinimumandMaximumare based on the domain of the associated dataset. However, you can define a differentMinimumandMaximumfor your purposes. - The
Automatic Namingoption assigns names that correspond to the thresholds of the new intervals. - Alternatively, you can select
Numbered Names Prefixed byto generate a pattern such as L1, L2, L3, etc., using a prefix string of your choice.
Workflow Animation
All of the above functions are demonstrated in the following animation, however, in no particular order.
