Supervised Learning: Markov Blanket
Markov Blanket
Given our objective of predicting the state of the variable diagnosis, i.e., Benign versus Malignant, we define diagnosis as the Target Node.
We need to specify this explicitly so that the Supervised Learning algorithm can focus on the characterization of the Target Node rather than on a representation of the entire Joint Probability Distribution (JPD) of the learning set.
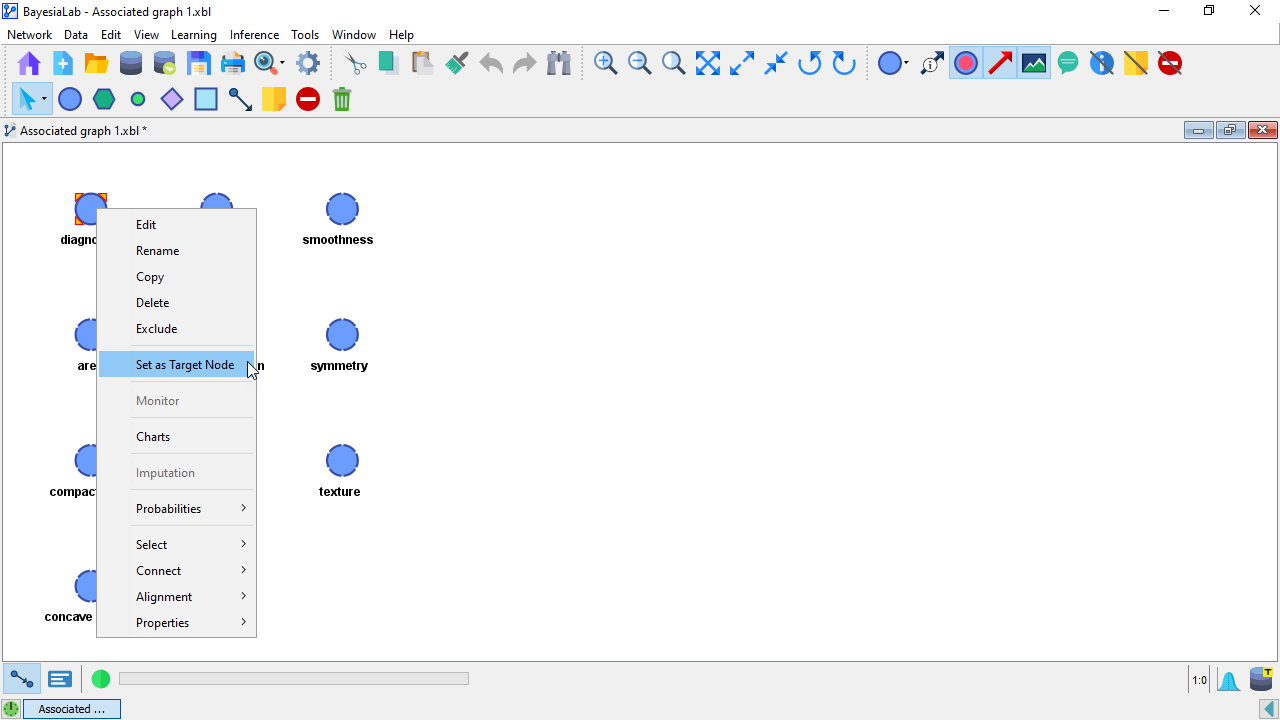
Upon defining the Target Node, all Supervised Learning algorithms become available under Menu > Learning > Supervised Learning.
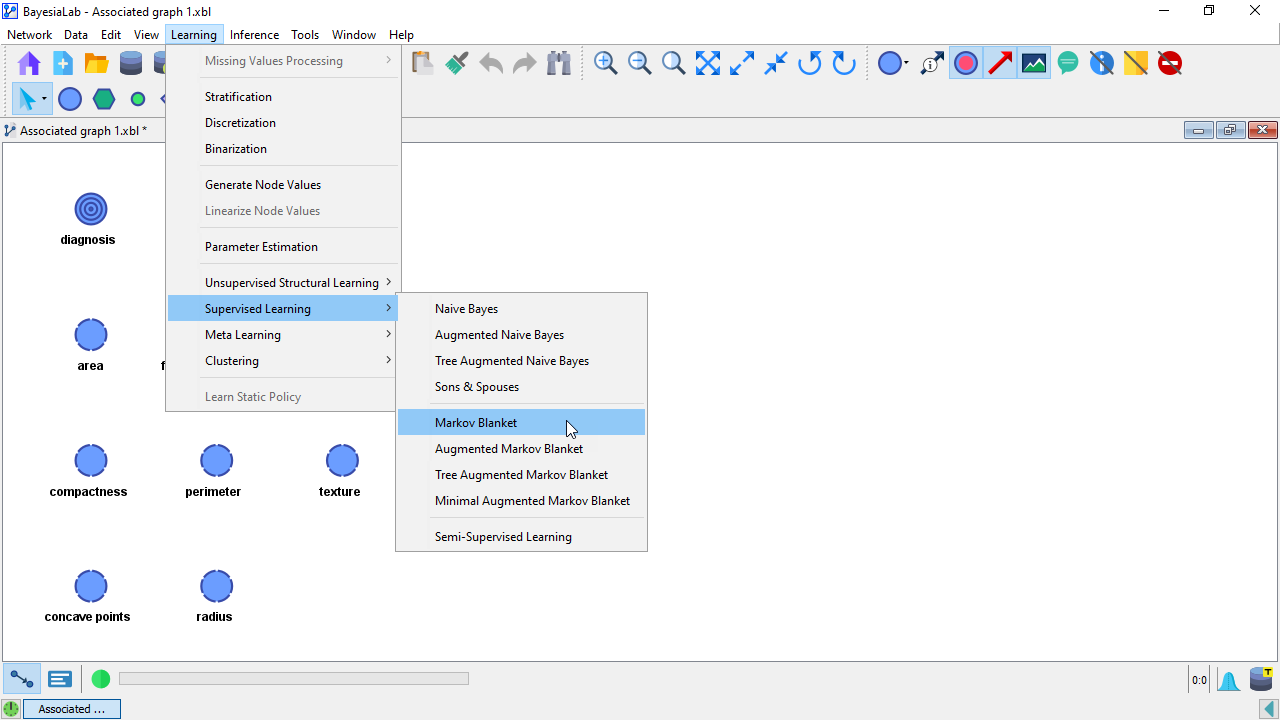
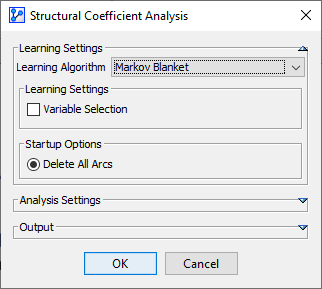
Markov Blanket Definition
Upon learning the Markov Blanket for diagnosis and after having applied the Automatic Layout (shortcut P), the resulting Bayesian network appears as follows:
We can see that the obtained network is a Naive structure on a subset of nodes.
This means that diagnosis has a direct probabilistic relationship with concave_points, fractal_dimension, texture, and perimeter.
All other nodes remain unconnected. The lack of their connections with the Target Node implies that these nodes are independent of the Target Node, given the nodes in the Markov Blanket.
Beyond distinguishing between predictors (connected nodes) and non-predictors (disconnected nodes), we can further examine the relationship versus the Target Node diagnosis by highlighting the Mutual Information of the arcs connecting the nodes.
This function is accessible in Validation Mode F5v by selecting Menu > Analysis > Visual > Overall > Arc > Mutual Information.
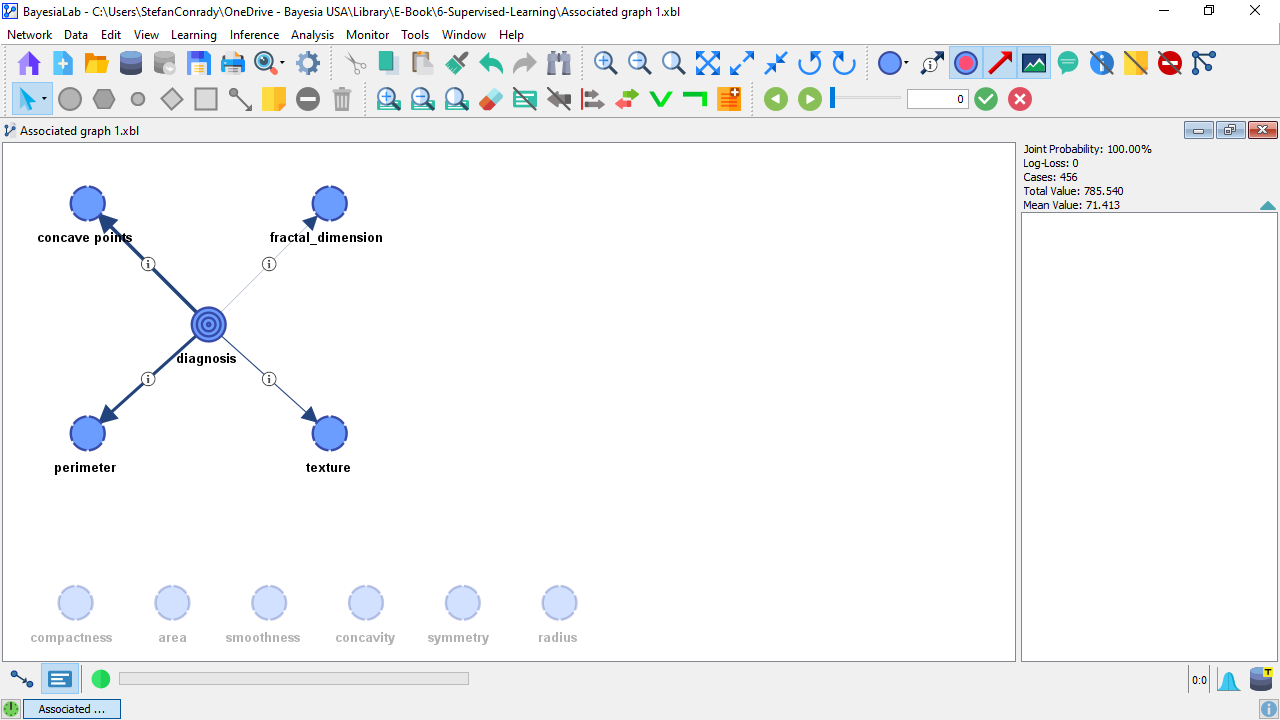
Each arc’s thickness is now proportional to the Mutual Information of the nodes it connects. Furthermore, the icon indicates that additional information, i.e., the Arc Comments, is available to be displayed.
So, we select Menu > View > Show Arc Comments. Alternatively, clicking the Show Arc Comment button in the Toolbar achieves the same .
This allows us to examine the Mutual Information between all nodes and the Target Node diagnosis, which enables us to gauge the relative importance of the nodes.
The top value shown in the box attached to each arc is the absolute value of the Mutual Information.
Below, the percentage refers to the Symmetric Normalized Mutual Information.
Performance Analysis
As we are not equipped with specific domain knowledge about the nodes, we will not further interpret these relationships but rather run an initial test regarding the Network Performance. We want to know how well this Markov Blanket model can predict the states of the diagnosis variable, i.e., Benign versus Malignant. This test is available via Menu > Analysis > Network Performance > Target.
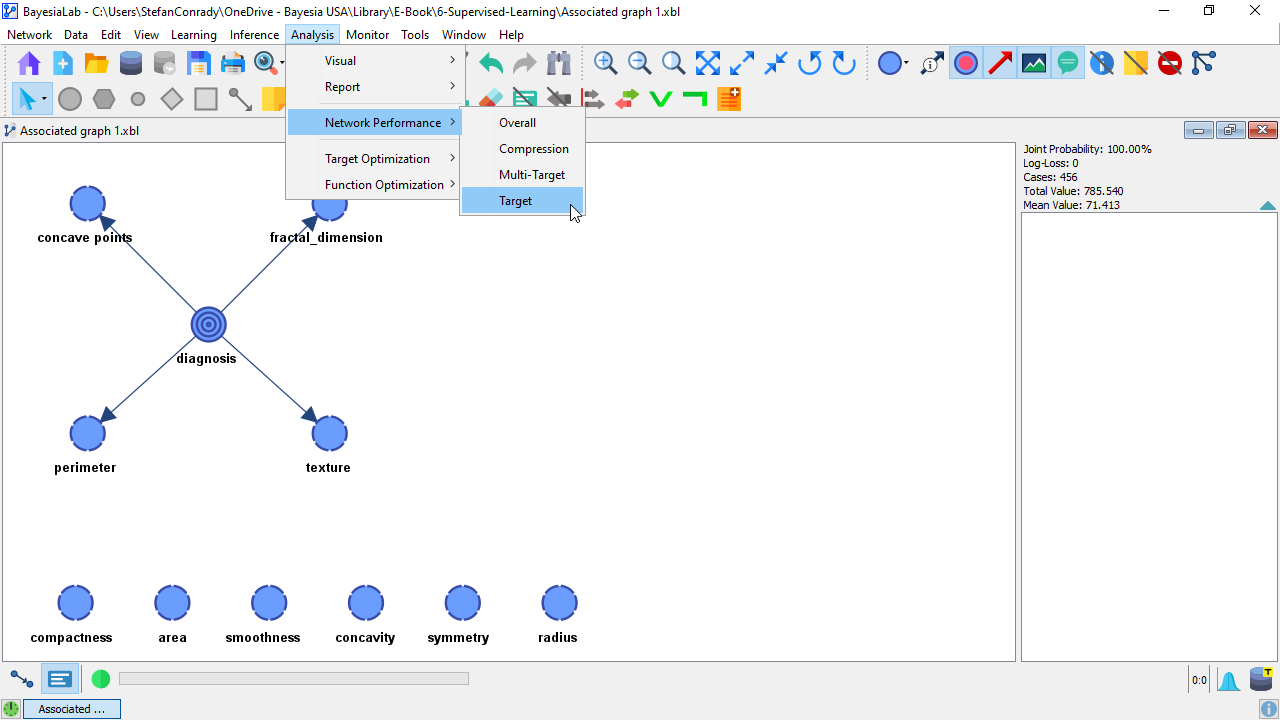
As the analysis starts, BayesiaLab prompts us to specify the Target Evaluation Setting. In the given context, we select Evaluate All States and proceed.
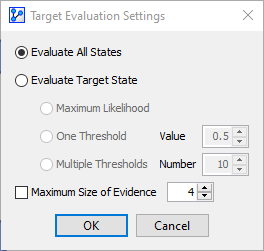
Using the previously defined Test Set for evaluating our model, we obtain the initial performance results, including metrics such as Total Precision, R, R2, etc.
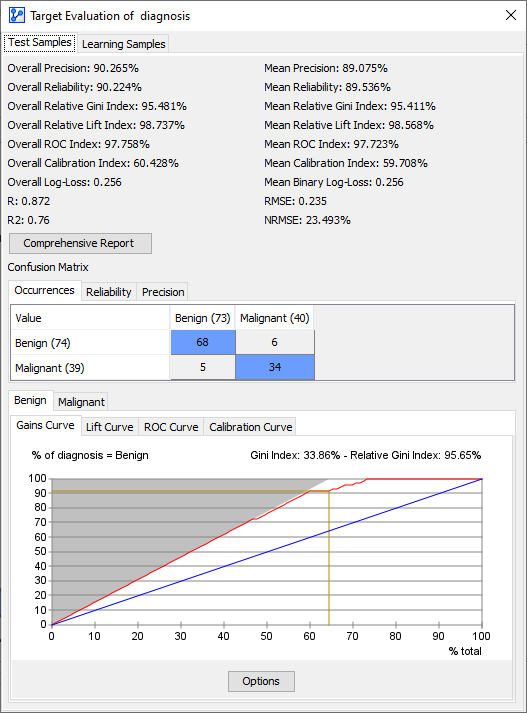
In the context of this example, the table in the center of the report, the so-called Confusion Matrix, is of special interest.
The Confusion Matrix features three tabs, Occurrences, Reliability, and Precision, which are illustrated below:
Of the 40 Malignant cases in the Test Set, 34 were identified correctly (True Positive Rate: 85%), and 6 were incorrectly predicted (False Negative Rate: 15%).\
Of the 73 Benign cases in the Test Set, 68 were correctly identified as Benign (True Negative Rate: 93.15%), and 5 were incorrectly identified as Malignant (False Positive Rate: 6.85%).
The Overall Precision, which is reported at the top of the report window, is computed as the total number of correct predictions (True Positives + True Negatives) divided by the total number of cases in the Test Set, i.e., (68+34)÷113=90.265%.
K-Folds Cross-Validation
An Overall Precision of around 90% is encouraging, but we must remember that we randomly selected the Test Set.
To mitigate any sampling artifacts that may occur in such a one-off Test Set, we can systematically learn networks on a series of different subsets and then aggregate the test results.
For this purpose, we perform a K-Folds Cross-Validation, which will iteratively select K different Learning Sets and Test Sets and then learn the corresponding networks and test their respective performance.
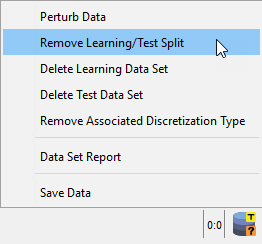
With this approach, we need to remove the original Learning Set and Test Set split. Right-clicking on the database icon in the lower right corner of the Graph Window brings up a menu. Here, we select Remove Learning/Test Split.
Then, K-Folds Cross-Validation can be started via Menu > Tools > Resampling > Target Evaluation > K-Fold:
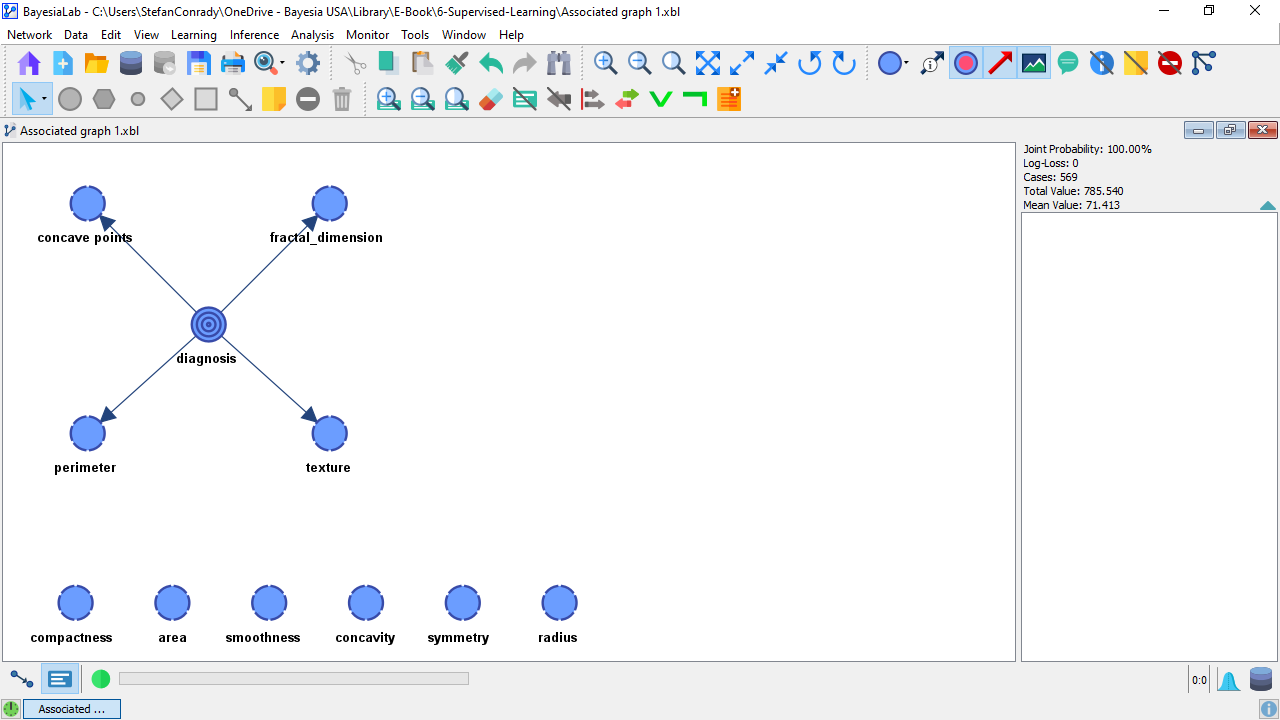
We use the same learning algorithm as before, i.e., the Markov Blanket, and choose K=10 as the number of sub-samples to be analyzed.
Of the total dataset of 569 cases, each of the ten iterations (folds) will create a Test Set of 56 randomly drawn samples and use the remaining 630 as the Learning Set. This means that BayesiaLab learns one network per Learning Set and then tests the performance on the respective Test Set. It is important to ensure that the Shuffle Samples option is checked.
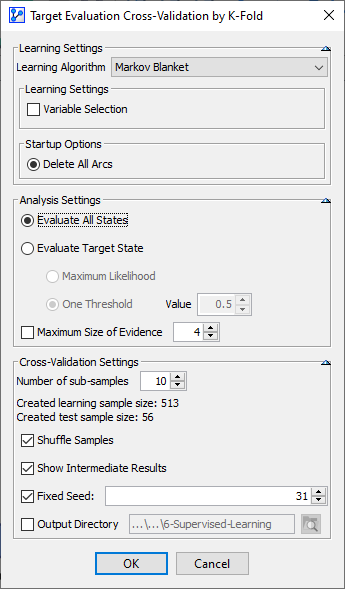
The summary, including the synthesized results, is shown below. These results confirm the good performance of this model.
The Total Precision is 92.97%, with a False Negative Rate of 11.32%. This means that 24 of the 212 Malignant cases were incorrectly predicted as Benign.
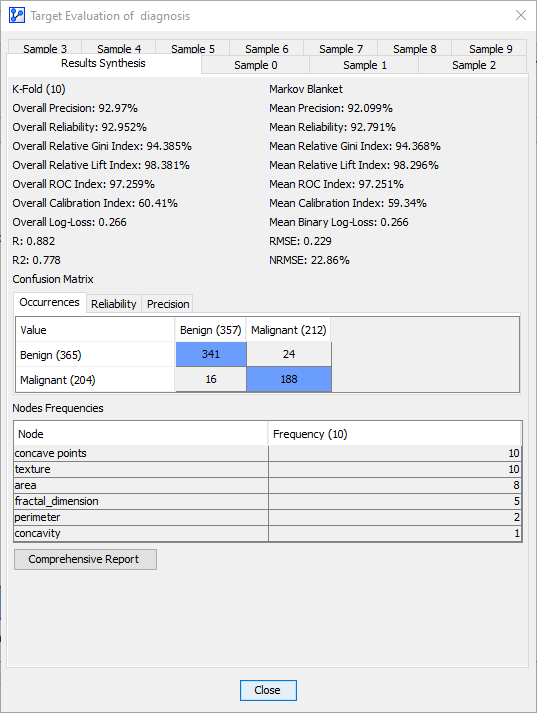
Clicking Comprehensive Report produces a summary with additional analysis options.
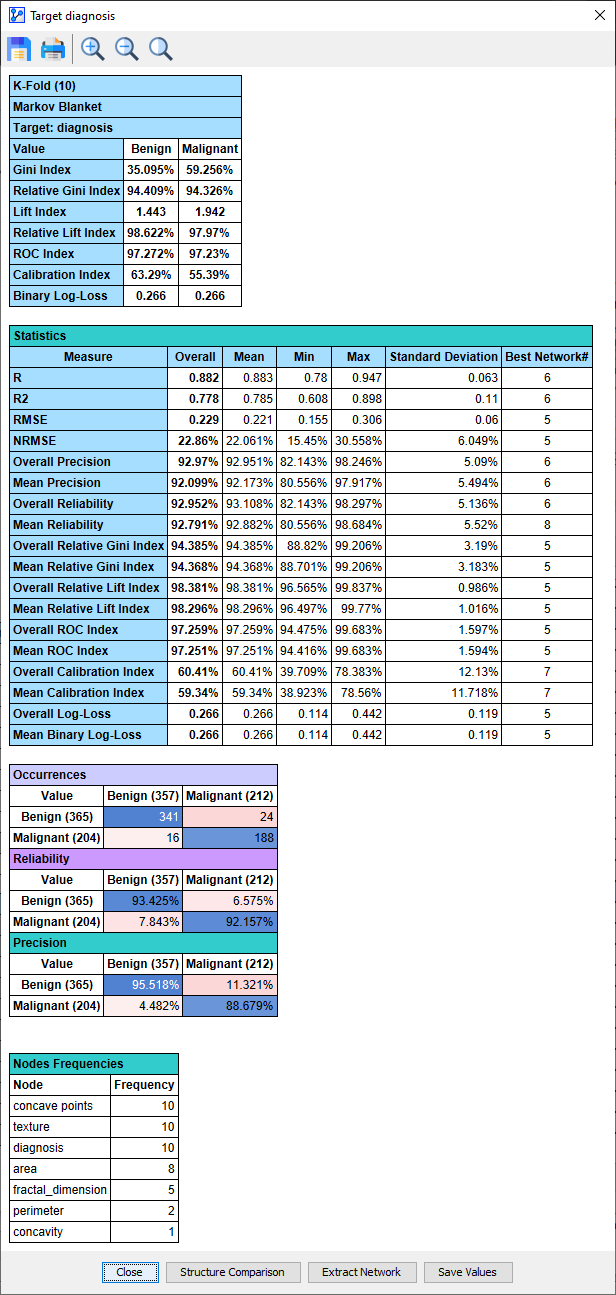
Interpreting the Cross-Validation Results
It is helpful to click the Network Comparison button to understand what exactly is happening during the K-Folds Cross-Validation. It brings up a Synthesis Structure of all the networks learned during the K-Folds Cross-Validation.
Black arcs in the Synthesis Structure above indicate that these arcs were present in the Reference Structure (below), i.e., the network that was learned on the basis of the original Learning Set.\
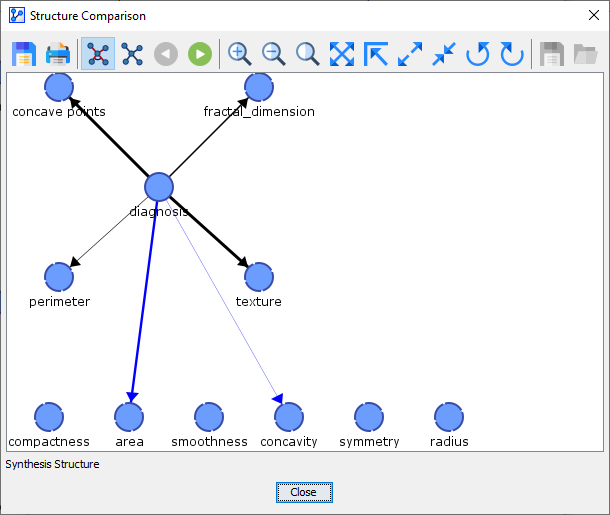
The thickness of the arcs in the Synthesis Structure reflects how often these links were found in the course of the K-Folds Cross-Validation. The blue-colored arc indicates that the link was only found in some folds but that it was not part of the Reference Structure. The thickness of the blue arc is also proportional to the number of folds in which that arc was added.\
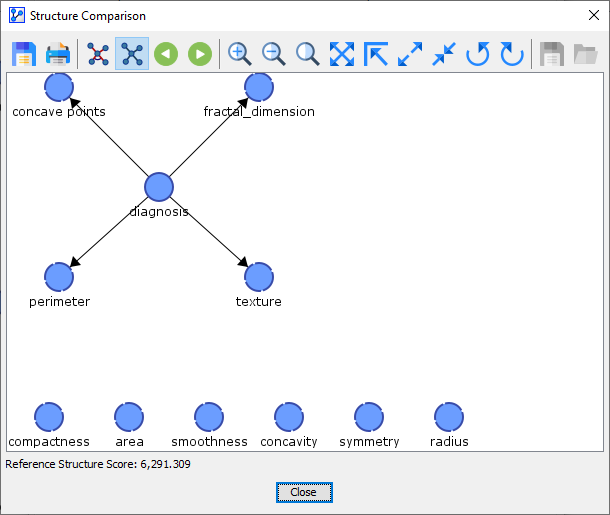
We can scroll through all the networks discovered during the K-Folds Cross-Validation using the record selector icons . The first structure after the Synthesis Structure is the Reference Structure, which was the current network when we started the K-Folds Cross-Validation.\
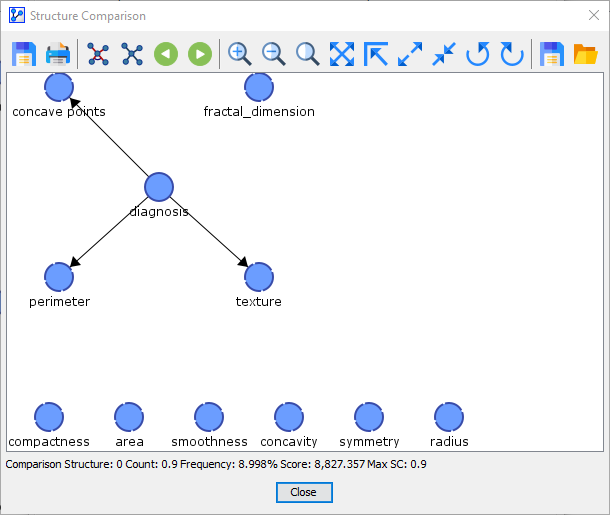
After the Reference Network, we arrive at Comparison Structure 0. This network structure was learned in 1 out of 10 folds.
Comparison Network 1 was found 1 out of 10 times.
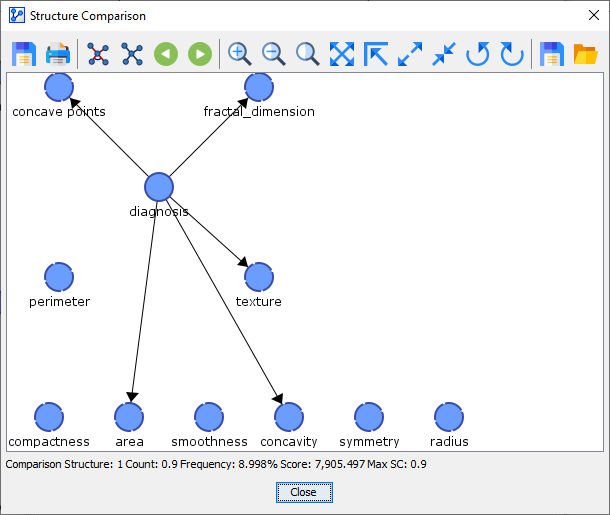
Comparison Network 2 was found 3 out of 10 times.
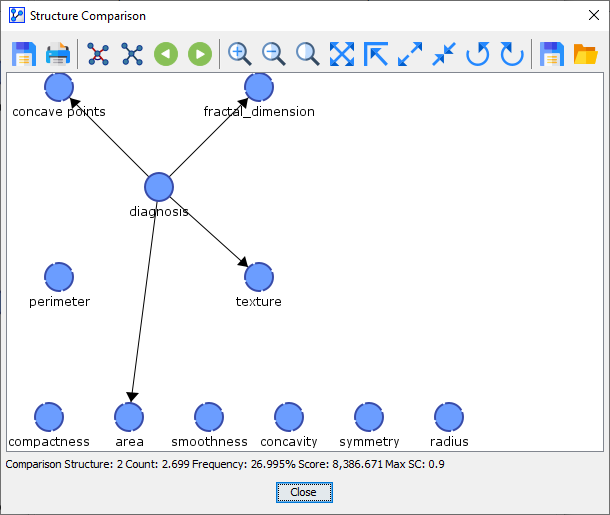
Comparison Network 3 was found 4 out of 10 times.
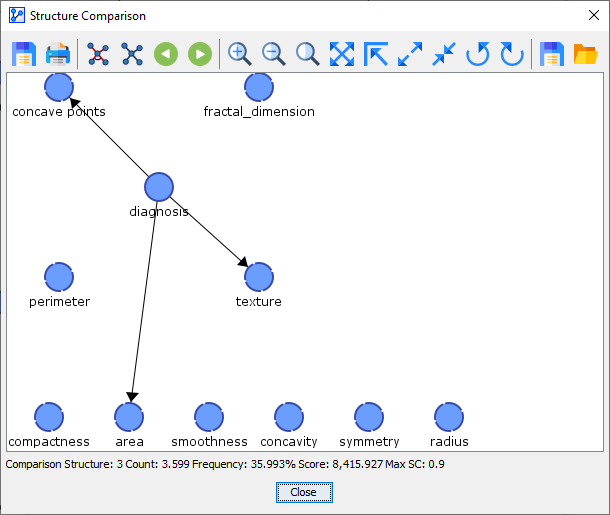
Comparison Network 4 was found 1 out of 10 times.
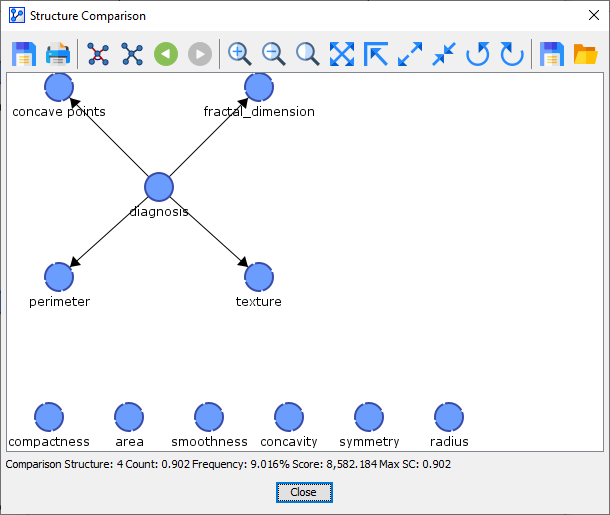
So, the first network we learned from the original Learning Set, the Reference Structure, was only found in 1 of the 10 networks learned during the 10-Fold Cross-Validation.
Given the relatively small sample size of the original Learning Set (431), it is unsurprising that larger sample sizes, i.e., 512 records in each fold of the 10-Fold Cross-Validation, would lead to alternative structures.
Markov Blanket Performance Summary
Performing the K-Fold Cross-Validation shows that the Overall Precision of a Markov Blanket model can approach 93%. However, a False Negative Rate of over 10% may prevent such a model from being useful for clinical purposes. In the context of diagnosing cancer, a False Negative means missing a malignant case.
As a result, we proceed to another algorithm to evaluate its potential for improved diagnostic performance: Supervised Learning: Augmented Markov Blanket.
