Conditional Probability Tables
Whereas the arcs connecting the nodes constitute the qualitative part of the network by indicating the direct probabilistic dependencies, conditional probability distributions represent the quantitative part (type and strength of the probabilistic relationships). The most commonly used representation models to describe these distributions are the conditional probability tables.

Reading a conditional probability table in BayesiaLab is carried out in the following way:
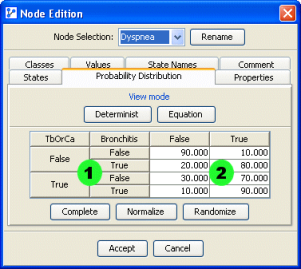
- Zone 1 corresponds to the value combinations of the parents of the node. Of course, this zone exists only if the node has at least one entering arc. When a node has parents, you can change their order by dragging the parent names inside the header of Zone 1. When a parent is moved, the conditional probability table is reorganized to take the modification into account.
- Zone 2 corresponds to the probability distributions conditioned on each case described by Zone 1, or to the a priori probability distribution in the absence of an entering arc. If the network has a database and the states of the node are not modified, a tooltip displays, for each probability, the number of corresponding cases in the database (taking into account the smoothing factor, if any) and the represented percentage of the database.
Example
The interpretation of the first line of this table is thus:
The probability of having Dyspnea is 10% when TbOrCa is False and Bronchitis is False.
Table Editing
The main problem with conditional probability tables is the exponential growth of the number of lines with respect to the number of parents. Acquiring their data can quickly become a tedious task. When databases exist, they can be filled automatically (learning of the parameters). It is also possible to use equations to describe probability distributions more concisely.
Probability entry can also be alleviated by using cut-and-paste facilities inside the same table, between different tables, or with external applications.
These tables also come with the classical cell selection tools, either by directly clicking on the cells or by clicking on the line/column headers. A click on a header with the Ctrl key pressed allows making an OR with the previous selection, and the same click with the Shift key makes an AND. A click with the Ctrl key on a cell allows selecting or unselecting the cell without changing the set of selected cells. This allows you to edit a cell that belongs to a selection and apply that edit to all other selected cells. A click on a cell with the Shift key pressed selects from the active cell to the pointed cell.
Probabilities can be copied and pasted to other tables or to external applications.
Complete
This operation consists of equally distributing the residual probability, defined as 100 minus the sum of the probabilities already defined on the line. If there are blank cells, this residual probability is distributed among those cells. Otherwise, if the residual probability is positive, this operation works like the Normalize operation over all the cells of the line.

Normalize
Probabilities are reduced or augmented in such a way that the relative weight of each remains unchanged. If there is at least a blank cell and the residual is positive, this operation corresponds to the Complete operation.
Randomize
All the cells of the Conditional Probability Table, or just the selected cells, are randomly filled.
Assessment
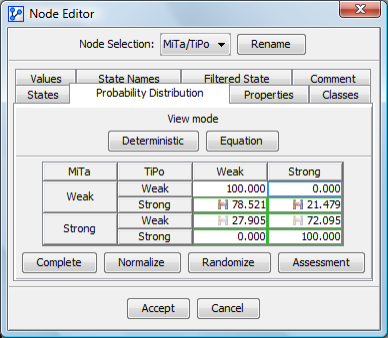
When experts are associated with the network, a button Assessment is displayed and is activated when a cell is selected. The border of the cells with assessments becomes green and the icon displayed in the cell indicates how important the disagreement between the experts is for this cell.
