Node Types and States
Context
- A node is one of the fundamental elements in a Bayesian network.
- In BayesiaLab, there are two basic types of probabilistic/chance nodes, each with a distinct visual representation.
Node Types
Discrete Nodes
| Discrete Nodes | |
|---|---|
Loading SVG... | A Discrete node represents a categorical variable with symbolic states, such as {Red, Green, Blue}, {True, False}, {Low, Medium, High}, or with a finite set of numerical values, such as {0, 1, 2} or {0.0, 0.1, 0.2, 0.3, 0.4, 0.5}. On the Graph Panel, a Discrete node appears as a solid blue disc with a solid outline. |
| Continuous Nodes | |
|---|---|
Loading SVG... | A Continuous node represents variables with continuous numerical values. On the Graph Panel, a Continuous node appears as a solid blue disc with a dashed outline. The breaks in the outline symbolize the fact that Continuous nodes have to be discretized, i.e., broken into bins. |
Node Status
| Node Appearance | Modeling Mode | Validation Mode | Node State |
|---|---|---|---|
 | Default Status: This is the default status of any node. | ||
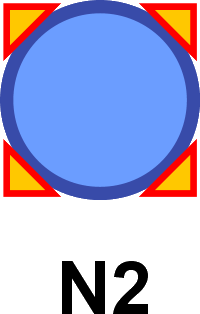 | Node Selected: Whenever you select a node on the Graph Panel, it is highlighted with red and orange corners. Subsequent editing actions, such as moving, excluding, or deleting, apply to all selected nodes. | ||
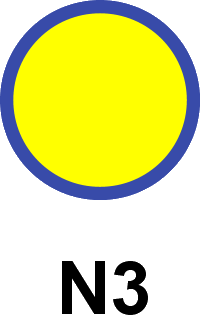 | Monitor Active: If you bring up a Monitor in the Monitor Panel, its corresponding node on the Graph Panel turns yellow. Upon deleting the Monitor, the node returns to its default status on the Graph Panel. | ||
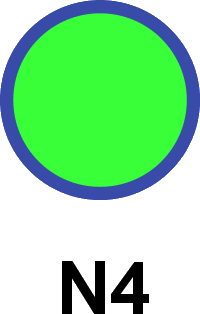 | Hard Evidence: Upon setting Hard Evidence on a node, its color changes to bright green. | ||
 | Static Likelihood Function: A mint color indicates that a static Likelihood function is associated with the node to define Virtual or Soft Evidence. | ||
 | Target Node: The bullseye design indicates that this node is set as the Target Node in a network. This means that a Supervised Learning algorithm can be utilized to learn a network that characterizes the Target Node. | ||
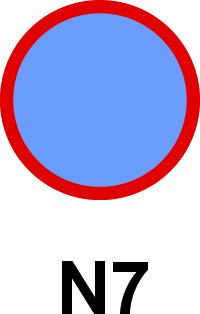 | Monitor Temporal Evolution: The red outline indicates that this node will be temporally monitored, i.e., tracked, as BayesiaLab iterates through time steps. This enables you to plot the node’s temporal evolution. | ||
 | Hidden Node: The “Hidden Node” status indicates that this node does not have any associated data (i.e., 100% of missing values). This occurs when the node is manually added to a network that has an associated dataset. As such, Hidden Nodes often refer to latent or unobserved concepts that are introduced based on theoretical considerations. | ||
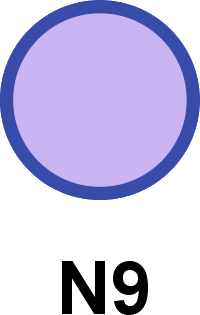 | Dynamic Likelihood Function: A purple color indicates that a dynamic Likelihood function is associated with the node to fix its probability distribution. | ||
 | Translucent: A node appears translucent or “greyed out” for several reasons. The node may be deselected via Show Classes and therefore excluded from any subsequent analysis, while still remaining part of the network and returning to display at any time. This appearance can also indicate that this node is below a user-set threshold during Visual Analysis. | ||
 | Excluded Node: An excluded node is virtually deleted. Excluding a node that is already part of a network removes any connected arcs. | ||
 | Intervention Node: For a Discrete or Continuous node to appear as a green square (observed Decision Node), two things must happen: (1) the node’s monitor must be changed from Observation to Intervention, and (2) evidence must be set on the node. In addition to its change in appearance, any inbound arcs are also removed. This reflects that performing an intervention on a node requires graph surgery on the network. | ||
 | Not Observable Node: This light shade of purple indicates that a node is Not Observable, i.e., the associated Cost is 0. As such, the node will not be included in the Adaptive Questionnaire, effect analysis, and optimization, for instance. |
