Class Editor
Context
- Beyond the basic Class operations described in Add Class and Select Classes, you can modify Classes in the Class Editor.
Usage
- There are two ways to open the Class Editor:
- Select
Graph Panel Context Menu > Edit Classes. - Select
Main Menu > Edit > Edit Classes.
- Select
- The Class Editor displays a list of the current Classes, excluding the Predefined Classes, and shows the number of nodes that are members of each Class.
- Ten buttons are available to perform specific functions related to the Classes.
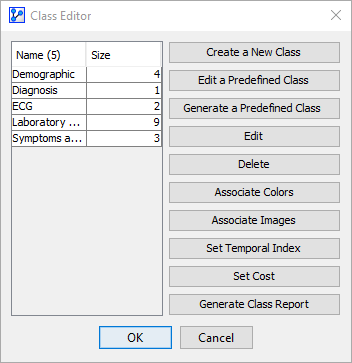
- The functions of all buttons are described below:
Create a New Class
Similar to creating a new Class from a node’s Contextual Menu (see Add Class), you can also create a new Class from the Class Editor.

Edit a Predefined Class
Editing a Predefined Class only refers to editing the membership of nodes in any of the Predefined Classes. However, the existing Predefined Classes cannot be deleted.
Workflow Animation
In the following example, we arbitrarily add Fasting Blood Sugar and Blood Pressure to the Predefined Class Non_Confounder.
Generate a Predefined Class
With Generate a Predefined Class you can automatically generate a very specific type of Classes.
Based on a qualitative analysis of the graph, this function generates one Class for each “layer” or “level” in the network.
- Root Nodes, i.e., nodes without parent nodes, represent the reference level and belong to the Class [Depth_0].
- Following the direction of the arcs from parent nodes one level down, the child nodes form Class [Depth_1].
- The last level comprises the Leaf Nodes, i.e., nodes that do not have any child nodes (descendants). They form Class [Depth_n], where n indicates the hierarchical separation from the root level.
Example
The following, simple causal Bayesian network represents the dependencies of engine components in an automobile. Here, the Classes corresponding to Depth are already defined and arranged hierarchically to illustrate the purpose of this function.
Note that our use of spatial references such as “down”, “below”, “depth”, “downward” reflects the convention that parent nodes are typically positioned vertically above their child nodes in a network graph.
Workflow Animation
The above layout, however, represents the endpoint. The following animation shows the workflow associated with producing this hierarchical representation.
The starting point is a typical model that represents individual causal relationships in a problem domain, in our case, an internal combustion engine.
And, the initial layout may reflect how domain experts have directly encoded their knowledge by drawing arcs. Anyone who is somewhat familiar with motor vehicles should be able to recognize and qualitatively validate each relationship in this model.
However, despite the validity of the model, a “big picture” is not immediately obvious.
In this context, generating Classes for Depth will be remarkably useful. In addition to defining the Classes, we apply colors to them and manually rearrange them to achieve an intuitive layout.
The animation shows the following steps:
- Right-click on the background of the Graph Panel to bring up the Context Menu
- Select
Edit Classesto open the Class Editor - Click
Generate a Predefined Class - Highlight all generated Classes, i.e., [Depth_0] through [Depth_n]
- Click
Associate Colors - Select
Associate Default Colors with Classes - Manually rearrange the color-coded Classes hierarchically (not shown)
- Right-click on the Classes icon to display individual Classes.
This hierarchical visualization of relationships can help with human understanding of the problem domain.
Given that Bayesian networks are a type of Directed Acyclic Graph, there are generally at least two levels, i.e., one for the parent nodes and one for the child nodes. The only exception would be the trivial case of a network consisting only of a single node.
Note that the visual arrangement of nodes does not at all affect the probabilistic and computational properties of the network.
Edit
With the Edit function, you can modify existing Classes to add or remove nodes as their members.
This is often very helpful for fine-tuning Classes after using Variable Clustering.
Example & Workflow Animation
The following example is based on a typical driver analysis study of customer satisfaction (see Seminar: Key Drivers Analysis and Optimization).
One key element in this study’s workflow is to group manifest variables into so-called clusters using BayesiaLab’s Variable Clustering function. In BayesiaLab, clusters are implemented as Classes, which means that a “node belonging to a cluster” translates into that node being a member of a Class representing the cluster.
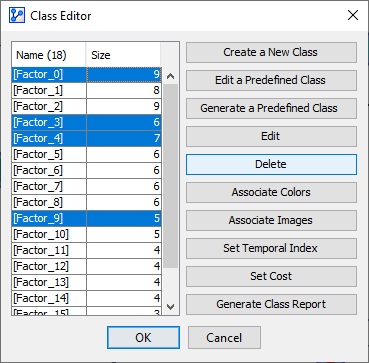
In this workflow example, we reassign the node (front/rear), which was originally assigned to the Class [Factor_9], to the Class [Factor_4]. We perform this reassignment based on our domain knowledge, i.e., we “overrule” the automatic assignment produced by Variable Clustering. Although the motivation is irrelevant for our example, we might think that this particular node fits better into Class [Factor_4].
There are several things to note in this context:
- The new Class assignment does not change the structure of the network. Although the node (front/rear) is now part of Class [Factor_4], its place in the network and its position on the screen remain the same.
- As the node colors had already been applied prior to the Class reassignment we just performed, the color of the node (front/rear) remains unchanged.
Delete
Clicking the Delete button deletes the Classes you selected in the list of all Classes in the Class Editor.
Note that deleting Classes does not delete the nodes that are members of those Classes.
Associate Colors
Creating and assigning new Classes does not change the appearance of nodes. By default, only the Classes icon informs you that Classes are defined.
Therefore, it can be practical to visualize the nodes’ memberships in Classes with distinct colors applied to the nodes. You can either apply a specific color to each Class or have BayesiaLab apply colors automatically.
Example & Workflow Animation
In the following animation, we let BayesiaLab automatically apply distinct colors to each Class:
- Right-click on the background of the Graph Panel to bring up the Contextual Menu
- Select
Edit Classesto bring up the Class Editor - Highlight at least one Class in the list of Classes
- Click the
Associate Colorsbutton - Then, check Associate Default Colors with Classes
- Click
OKto confirm - Click
OKto close the Class Editor
Associate Images
With the Associate Images function, you can apply specific images, typically icons, to nodes that are members of selected Classes.
Example & Workflow Animation
In the following animation, we attach a heart icon to the nodes that belong to the Class ECG.
- Right-click on the background of the Graph Panel to bring up the Contextual Menu
- Select
Edit Classesto bring up the Class Editor - Highlight at least one Class in the list of Classes
- Click the
Associate Imagesbutton - Check the
Imagecheckbox - Select the image you want to attach
- Click
OKto confirm the selection - Click
OKto close the Class Editor
Set Temporal Index
Temporal Indices allow you to specify a time order of nodes in a Bayesian network, which is taken into account during network learning.
You can apply a Temporal Index node by node (see Temporal Indices), or apply one to all nodes within a Class via the Class Editor:
- Right-click on the background of the Graph Panel to bring up the Context Menu
- Select
Edit Classesto bring up the Class Editor - Highlight at least one Class in the list of Classes
- Click the
Set Temporal Indexbutton - Check the checkbox and enter the Temporal Index you want to set
- Confirm the selection by clicking
OK. - Click
OKto close the Class Editor
Set Cost
By defining a Cost of a node, you specify the cost (or effort) of observing the node.
You can apply Cost node by node (see Cost Management), or apply the same Cost to all nodes within a Class via the Class Editor:
- Right-click on the background of the Graph Panel to bring up the Contextual Menu
- Select
Edit Classesto bring up the Class Editor - Highlight at least one Class in the list of Classes
- Click the
Set Costbutton - Check the checkbox and enter the Cost you want to set.
Note: unless specified, the default value of Cost is 1 for all nodes
It is not the classes to which any of these properties, e.g., Cost, Temporal Index, Color, etc., are applied but to the nodes contained in these classes at the time when these properties are applied. If nodes are added to a Class after a property had already been applied to the Class, the newly-added nodes will not “inherit” those properties previously applied to the Class.
Generate a Class Report
To Generate a Class Report is a convenient way to obtain a summary of all associations between nodes and Classes:
- Right-click on the background of the Graph Panel to bring up the Contextual Menu
- Select
Edit Classesto bring up the Class Editor - Click the
Generate Class Reportbutton
The generated Class Report contains two tables with two columns each:
- The first table features Class in the left column and Nodes in the right column. The Classes column is sorted alphabetically.
- The second table features Nodes in the left column and Classes in the right column. Now, the Nodes column is sorted alphabetically.
This layout is particularly helpful for detecting nodes that are assigned to multiple Classes by accident.
As with all reports in BayesiaLab, you can save the report in HTML format, which can subsequently be opened in spreadsheet software, such as Excel, for further formatting or editing.