Monitor Panel Contextual Menu
Context
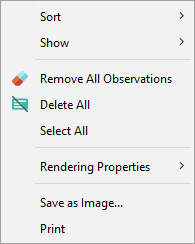
The Monitor Panel Contextual Menu contains important functions for displaying, formatting, and arranging Monitors inside the Monitor Panel.
Usage
The following animation shows how right-clicking on the background of the Monitor Panel brings up its Contextual Menu:
Each menu item is explained in the sections below:
Sort
The first element of the Contextual Menu covers the sorting functions available for the Monitors in the Monitor Panel:

Target Correlation- Displays the Monitors of all nodes in the network graph and sorts them from high to low according to their Mutual Information with the Target Node.
- If you have selected a subset of nodes, only they will be displayed in the Monitor Panel and sorted.
- The Monitors of Translucent Nodes will not be displayed.
- If there is no Target Node specified in the network, this sort function is not available.
Target State Correlation- Displays the Monitors of all nodes in the network graph and sorts them from high to low according to their Binary Mutual Information with the Target State.
- If you have selected a subset of nodes, only they will be displayed in the Monitor Panel and sorted.
- The Monitors of Translucent Nodes will not be displayed.
- If there is no Target Node specified in the network, this sort function is not available.
Less Probable Evidence- Sorts the Monitors of the observed nodes from the least probable evidence (that degrades the joint probability the most) to the most probable evidence.
- Given that a network represents a generalization of a domain, it features mostly “typical” or “normal” observations.
- Highlighting “less probable evidence” is useful for detecting those nodes that reduce the joint probability. This implies that such nodes contain atypical evidence with regard to the given network.
Entropy- Sorts the Monitors of the observed nodes in descending order according to their Entropy value, i.e., from the highest to the lowest uncertainty.
- As the value of Entropy depends on the number of states of a node, it is difficult to compare the Entropy values between nodes with a different number of states.
Normalized Entropy- Sorts the Monitors of the observed nodes in descending order according to the value of their Normalized Entropy.
- The Normalized Entropy takes into account the number of states and, thus, allows comparing all nodes.
Value- Sorts the Monitors of the observed nodes in descending order according to their Values.
Name- Sorts the Monitors of the observed nodes in alphabetical order according to the currently displayed names.
- If the Long Names are shown in the Monitor Panel, they serve as the basis for ordering; otherwise, the Node Names serve as the basis for sorting.
- Sorts the Monitors of the observed nodes in alphabetical order according to the currently displayed names.
Temporal Index- Sorts the Monitors according to their Temporal Index, from low to high.
- Monitors without a Temporal Index are placed last.
Number of States- Sorts the Monitors of the observed nodes according to the number of Node States, from high to low.
R2- The R2 (R-squared) value represents how well the discrete representation of a discretized variable represents the underlying distribution of the original continuous values.
- Selecting R2 sorts all Monitors according to the R2 value in descending order.
- For discrete nodes, which did not have to be discretized during data import, the R2 value is always 1. As a result, the sort function will move the Monitors of discrete nodes to the top.
Note: Some of the above sort functions do not depend on whether any evidence is set, such as Node Name, Temporal Index, Number of States, and R2. These values are static and do not change with evidence.
Show
The second element of the Contextual Menu provides display options for the Monitors in the Monitor Panel.
Long Name of Nodes- Display the Long Names of each node in the Monitors.
- For those nodes, for which no Long Names have been defined, their regular Node Names remain on display in their respective Monitors.
Long Name of States- By selecting
Long Name of States, BayesiaLab will display the Long State Names in the Monitors. - For those nodes, for which no Long Names of States have been defined, the normal State Names remain on display in their respective Monitors.
- By selecting
Probabilities in Scientific Notation- By selecting Probabilities in Scientific Notation, you can display the probabilities of each bin in scientific notation.
Fit Monitor Widths to Content- Especially when using Long Names of Nodes and Long Names of States, the text labels in the Monitor may be truncated.
- By selecting
Fit Monitor Widths to Content, BayesiaLab will automatically adjust the widths of all Monitors so that the complete labels are shown. - If you add additional Monitors to the Monitor Panel afterward, and their labels are even longer, you need to select
Fit Widths to Contentagain to avoid truncation.
Workflow Animation
The following animation illustrates the above four functions:
Show (Information Panel)
The bottom section within the Show sub-menu refers to items that can be displayed in the Information Panel, right at the top of the Monitor Panel.
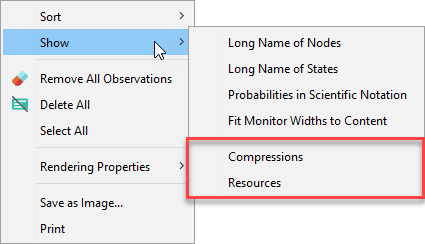
- Selecting
Compressionadds the following two items to the Information Panel: - Selecting
Resourcesdisplays the sum of all Utility Nodes given the evidence set.
Remove All Observations/Delete All/Select All
This section of menu items contains some of the most frequently used functions used in the Monitor Panel.
Remove All Observations- Selecting this menu item, also marked with the icon , removes all observations from all nodes, i.e., removes any evidence currently set on any nodes in the network, regardless of whether the nodes have an associated Monitor in the Monitor Panel or not.
- The same function is also available from the Toolbar by clicking the icon .
Delete All- Selecting this menu item, also marked with the icon , removes all Monitors from the Monitor Panel.
- The same function is also available from the Toolbar by clicking the icon .
- Note that removing the Monitors does not remove any evidence set on the Monitors.
Select All-
Selects all Monitors in the Monitor Panel.
-
If your cursor is inside the Monitor Panel, the keyboard shortcut
Ctrl+Aachieves the same. -
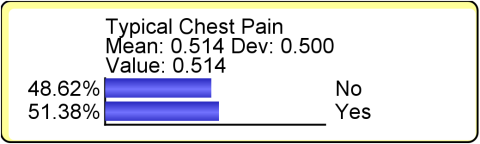
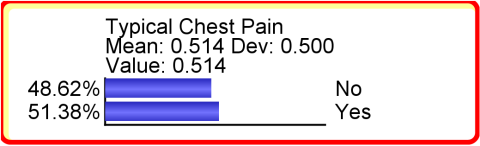
Selected Monitors are highlighted with a red outline:
-
Not-Selected Monitor
-
Selected Monitor
-
-
Note that the Select All function only selects the Monitors in the Monitor Panel. It does not select all corresponding Nodes in the Graph Panel.
-
Rendering Properties
This item in the Contextual Menu relates to the appearance of the Information Panel and the Monitor Panel.
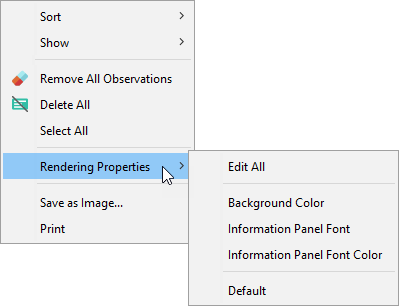
Edit All brings up simultaneously all of the following settings, which can also be accessed individually:
Background Color- Allows you to choose the background color of the Monitor Panel.
- Clicking reverts this setting to the default value.
Information Panel Font- Determines the style of the font displayed in the Information Panel.
- Clicking reverts this setting to the default value.
Information Panel Font Color- Allows you to set the color of the font displayed in the Information Panel.
- Clicking reverts this setting to the default value.
Defaults- Returns all of the above settings to their default values.
Save as Image…
This item brings up a dialog box for saving an image of the Monitors currently displayed in the Monitor Panel.
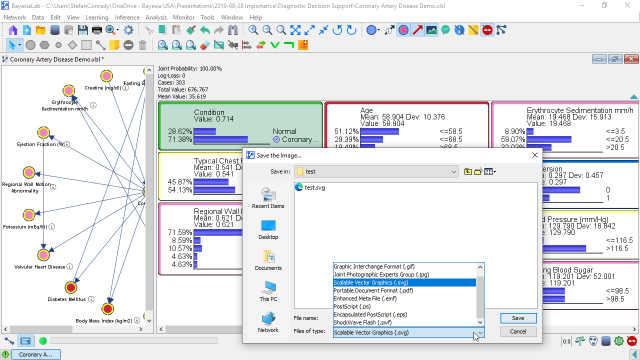
Whenever possible, you should use a vector-based format, such as svg or emf for saving images. This will allow you to rescale the saved image without loss of resolution in your target application, e.g., PowerPoint. If you can’t use a vector format, use a lossless pixel-based format like png. Try to avoid the jpg format, as it will reduce the quality of the saved image. Note that the actual size of the object is taken into account for the creation of images that are not in a vector format. You can then zoom in to increase the resolution of the created image.
This item brings up a printing assistant that allows you to print the contents of the Monitor Panel.