Mean, Value, and Standard Deviations
For Continuous Nodes or Discrete Nodes with numerical states, a Monitor displays the following items:
- The Expected Value (Value) is shown in all Monitors, regardless of the node type (categorical or numerical).
- The Mean Value (Mean) and its Standard Deviation (Dev) are displayed only in the Monitors of numerical nodes.
Examples
Categorical Node
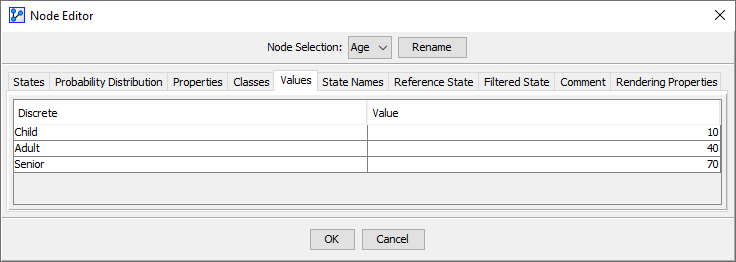
Consider the discrete node with three categorical Node States:
- Child
- Adult
- Senior
Categorical Node with Assigned State Values
In the Node Editor, you can assign State Values to the Node States of .
For each node, the Expected Value is computed using the assigned State Values and the marginal probability distribution of the Node States:
Where is the marginal probability of state and is its associated value.
The Monitor shows as the Value of .
The Monitor of a categorical node does not show a Mean value.
Discrete Numerical Variable
Suppose the node has three numerical Node States instead of categorical ones.
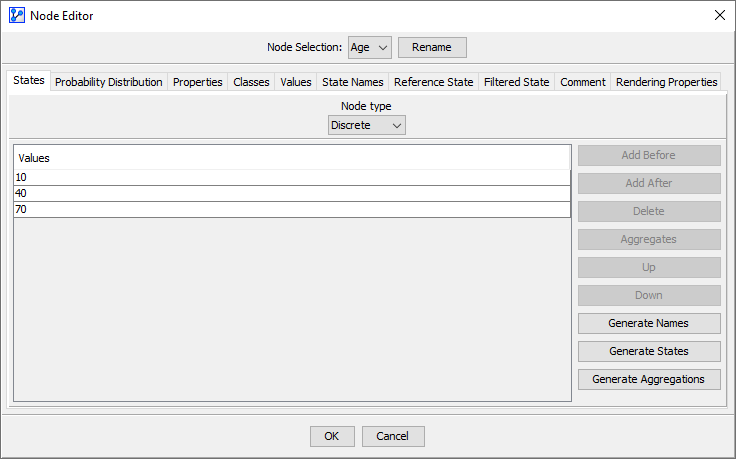
No State Values Specified
If State Values are not specified in the Node Editor, BayesiaLab uses the numerical values of the Node States as the State Values.
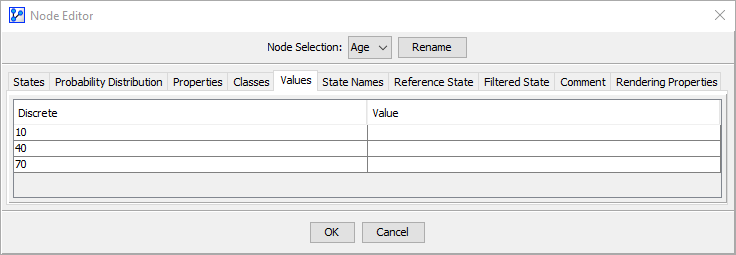
The Mean is computed using the numerical values of the Node States and their marginal probabilities:
Where is the numerical value of the Node State.
In this case, Mean and Value are identical.
State Values Specified
If State Values are specified in the Node Editor, they are used to calculate Value.
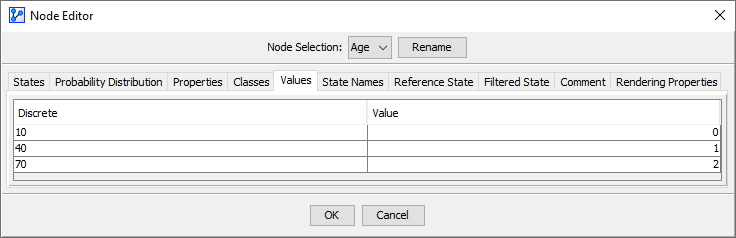
The Expected Value is calculated as:
Where is the assigned State Value.
In this case, Mean and Value are not identical.
Continuous Numerical Variable
For a continuous variable Age defined in the domain [0; 99], discretized into three states:
- Child: [0; 18]
- Adult: ]18; 65]
- Senior: ]65; 99]
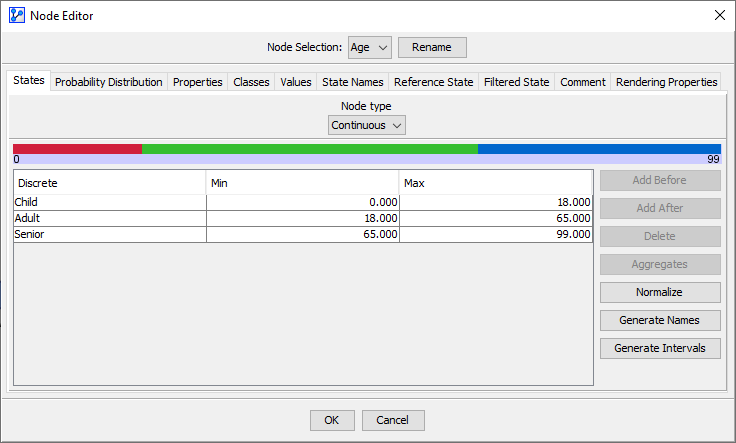
The Monitor displays Mean (m), Standard Deviation (Dev), and Expected Value (v).
Value Delta
If evidence modifies the node’s distribution, the Monitor displays a delta value next to Value:
This delta is the difference between the current Expected Value and either:
- The Expected Value before evidence was set.
- The Reference Probability Distribution.
Special Case: Some Node States Without Values
If only some Node States have values, the Expected Value is computed from the subset of Node States with values:
If only one Node State has a value, the Monitor does not report .