BLS Session Dashboard
Context
The Session Dashboard tab offers tools for analyzing the usage of Floating Token Licenses or Elastic Pricing Licenses that are associated with Accounts of which you are a Manager.
Filters

- Given the wealth of information available on the Session Dashboard, you may want to limit the presentation of data to certain subsets.
- You can set filters for:
- Users
- Subscriptions
- Time Periods
- Any filter you define here applies to all Dashboard Views.
Dashboard Views
Charts
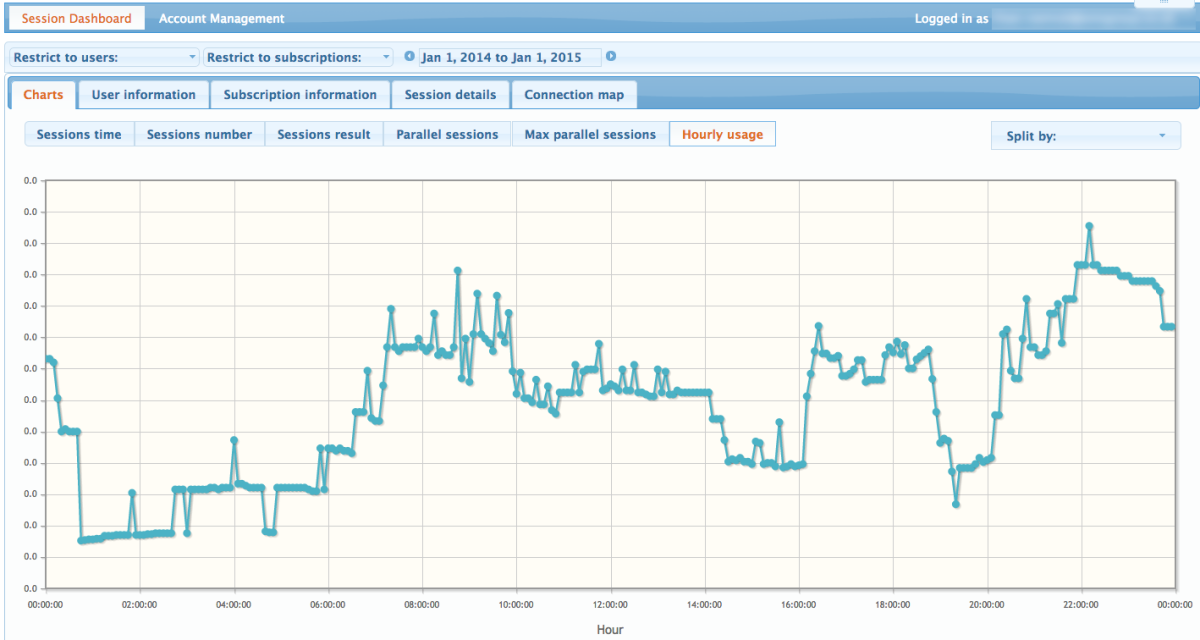
Under the Charts tab, you can view plots for numerous usage metrics:
- Sessions time: total time of usage by day
- Sessions number: total number of sessions by day
- Session result: the failure rate of sessions, e.g., due to connection problems with BLS
- Parallel sessions: number of concurrent users by day
- Max parallel sessions: maximum number of simultaneous user sessions in a day
- Hourly usage: usage by hour
User Information
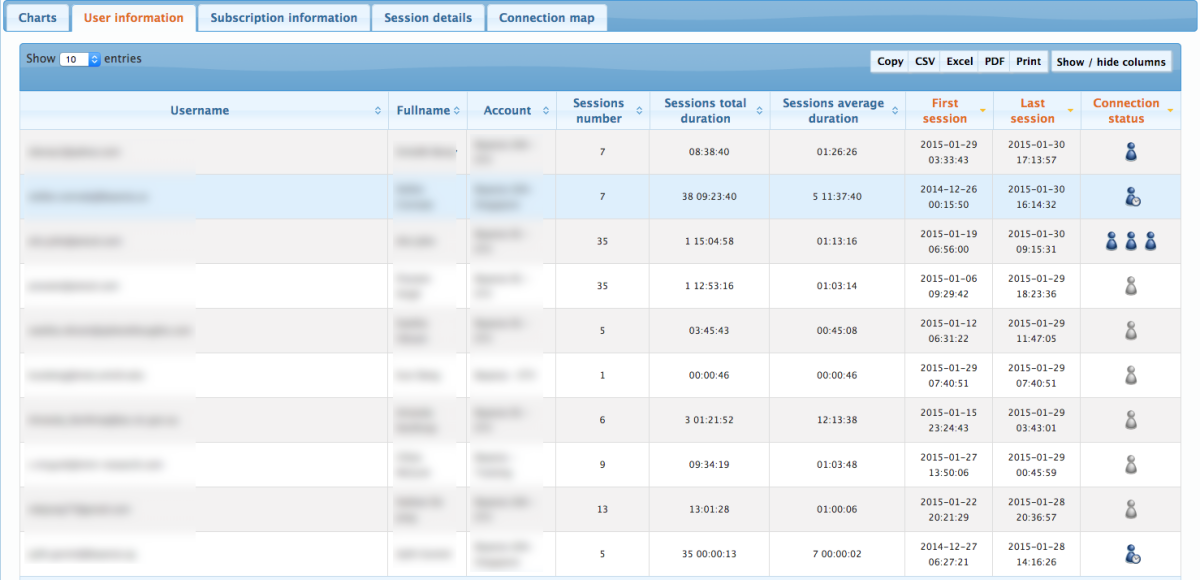
The User Information tab provides an overview of the current usage of your Floating Token Licenses for each user. Icons indicate the three possible connection states of each user:
 the user is not running BayesiaLab.
 the user is currently connected to BLS.
 the user is currently “borrowing a token” and running BayesiaLab offline without a connection to BLS.
Subscription Information
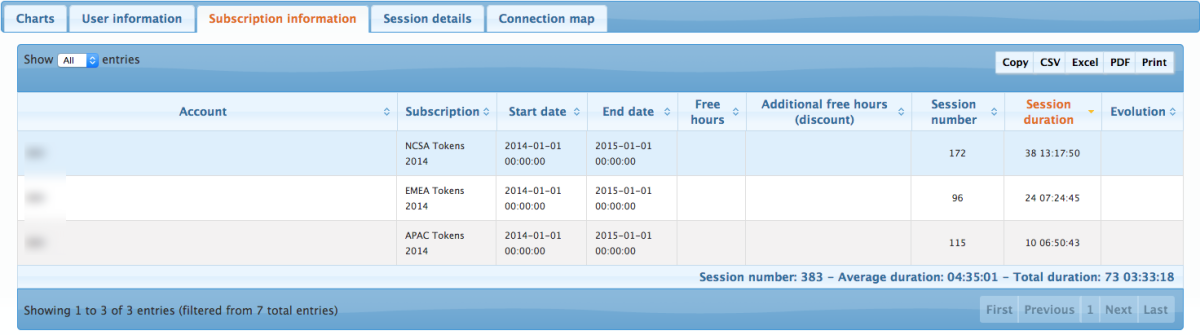
The Subscription Information tab shows the usage for each subscription that is associated with your Account.
Session Details
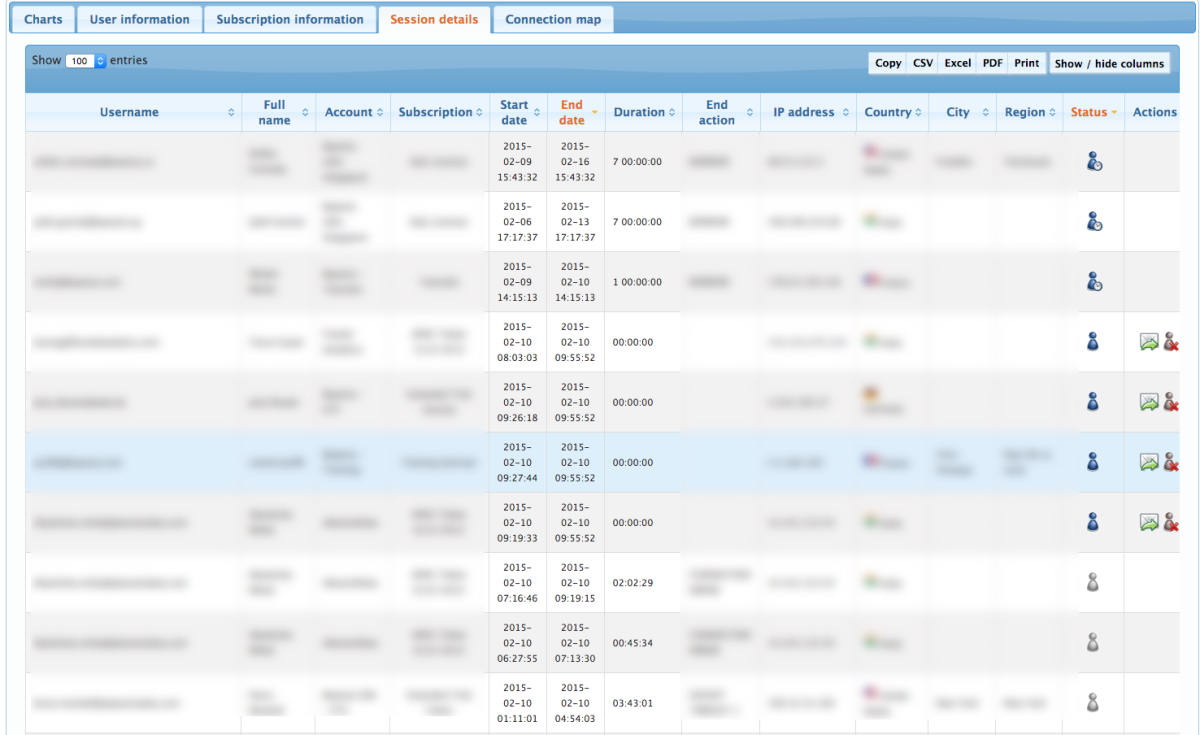
The Sessions Details tab lists all User Sessions, past and present.
Actions
-
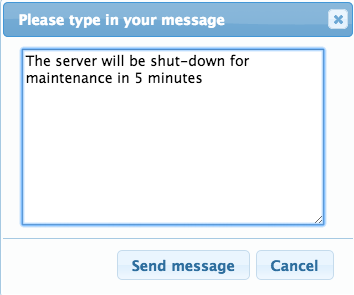
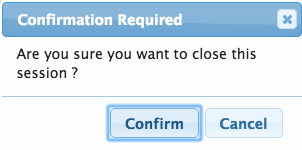
In the Actions column, a Manager can send messages to any User who is currently connected to BLS or, if necessary, close or “kill” any active Session.
-
Send Message

-
Close Session

-
Closing a Session can be helpful, for instance, when a user forgets to close his BayesiaLab session, thus “hogging” a token and preventing another User from starting a Session.
Connection Map
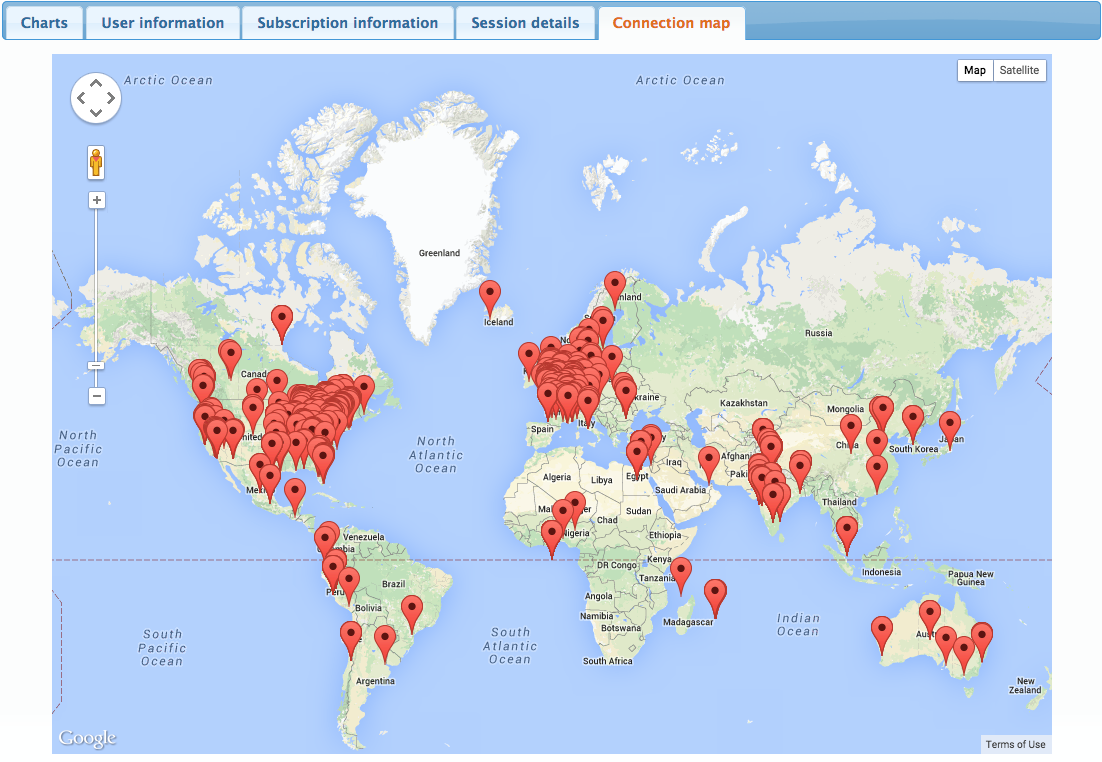
The Connection Map shows all the locations where your BayesiaLab tokens have been used.