
Importing the Test Dataset into BayesiaLab
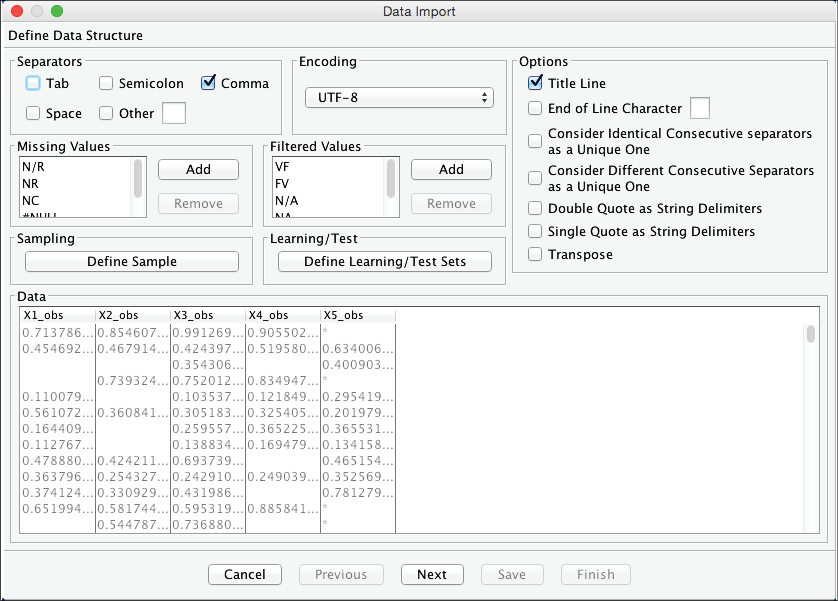
We show the first two steps of the Data Import Wizard only for reference, as their options have already been discussed in previous chapters.
Our test dataset consisting of 10,000 records was saved as a CSV file, so we start the import process via Menus > Data > Open Data Source > Text File.
Step 1: Data Structure Definition
Note the missing values in columns , , and in the Data Panel. Column features Filtered Values, which are marked with an asterisk (*).
Step 2: Definition of Variable Types
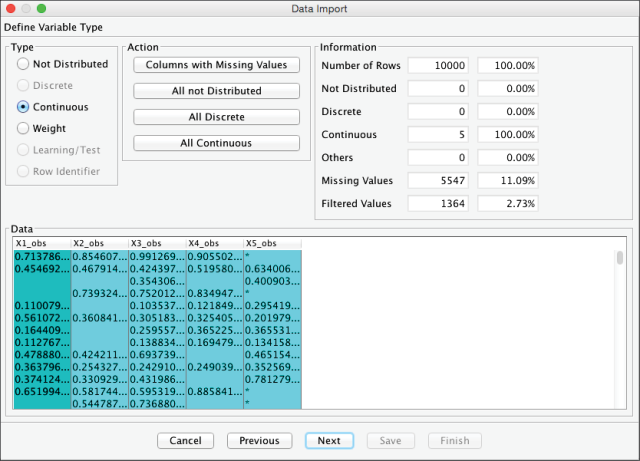
The next step of the Data Import Wizard requires no further input, but we can review the statistics provided in the Information Panel: we have 5,547 missing values (=11.09% of all cells in the Data panel) and 1,364 Filtered Values (=2.73%).
Step 3: Data Selection, Filtering, and Missing Values Processing
The next screen brings us to the core task of selecting the Missing Values Processing method. In the screenshot, the default option Structural EM is pre-selected, but we will explore all options systematically from the top. The default method can be specified under Menus > Window > Preferences > Data > Import & Associate > Missing & Filtered Values.
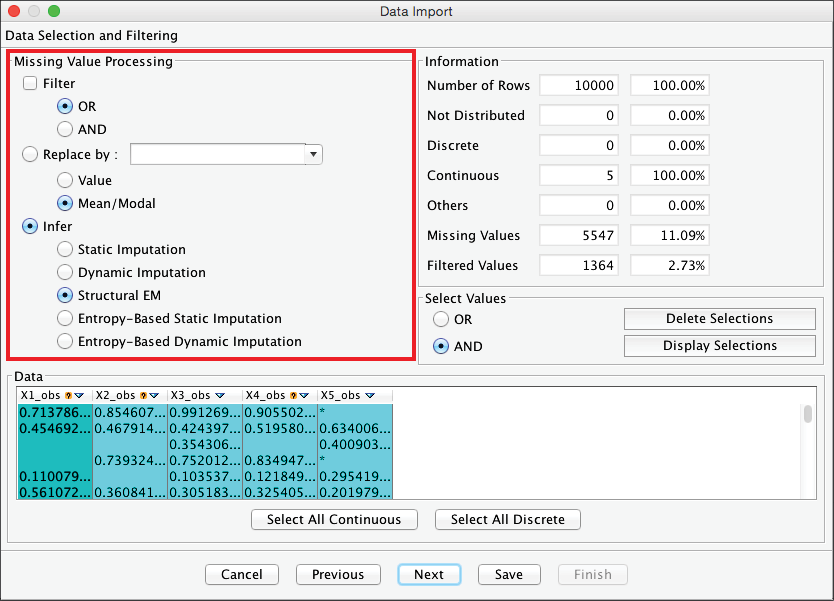
We explain and evaluate each Missing Values Processing method separately. Please select the topic below or open it in the navigation bar.