Relationship with Target Node (9.0)
Context
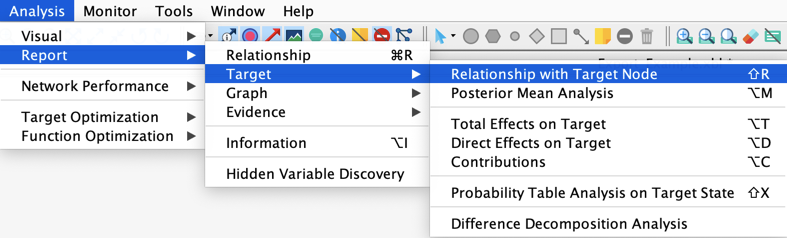
Analysis | Report | Target | Relationship with Target Node
This function, which was called in previous versions Correlation with Target Node (opens in a new tab), generates a comprehensive report with a lot of metrics related to the Target node. This report is also generated at the end of Data Clustering (opens in a new tab) for analyzing the created latent variable.
New Feature: Max and Min Bayes Factors
The tables describing the analyzes of the nodes with each Target State have been simplified.
The Maximal Positive and Negative Variations are now replaced by Bayes Factors:
where e is a state of the node under analysis, and s is the Target State.
Example
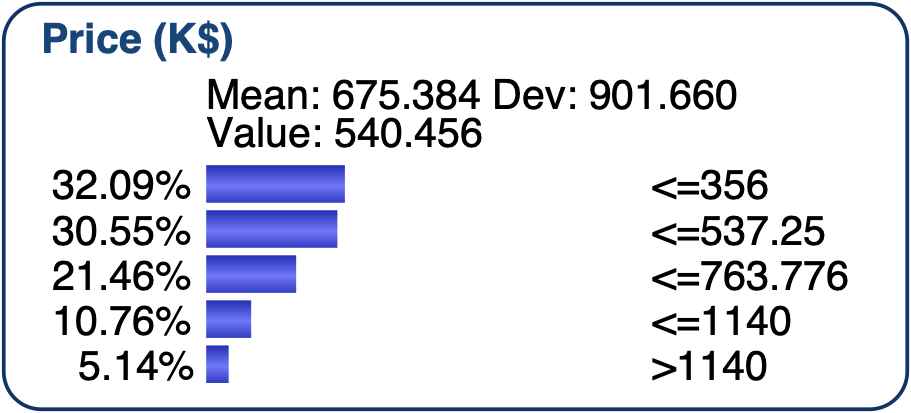
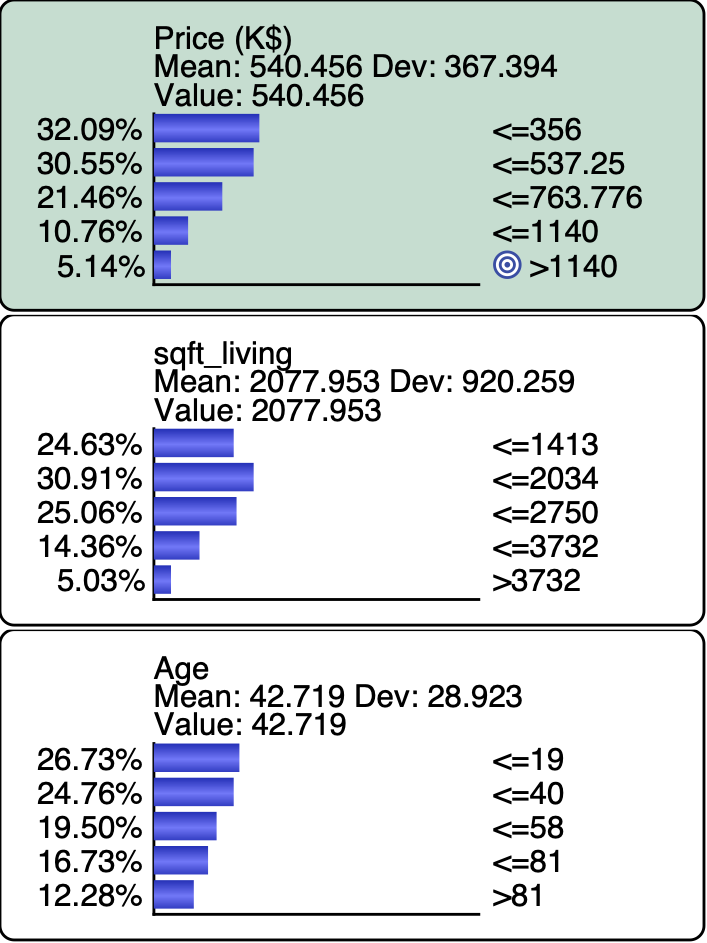
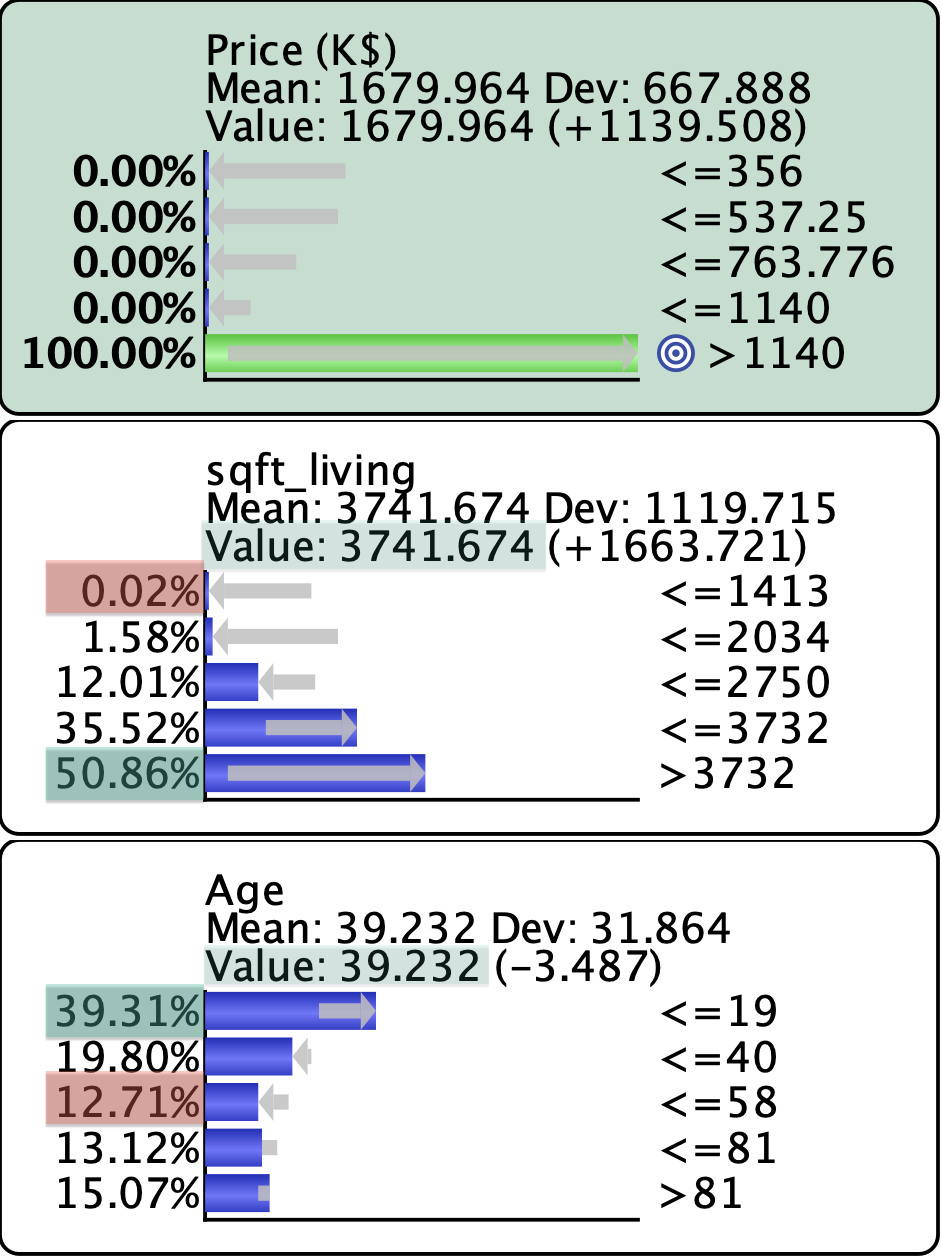
Let's use the network below and analyze the relationship of the nodes with the target state s, the fifth state of the Target node, Price (K$) > 1140
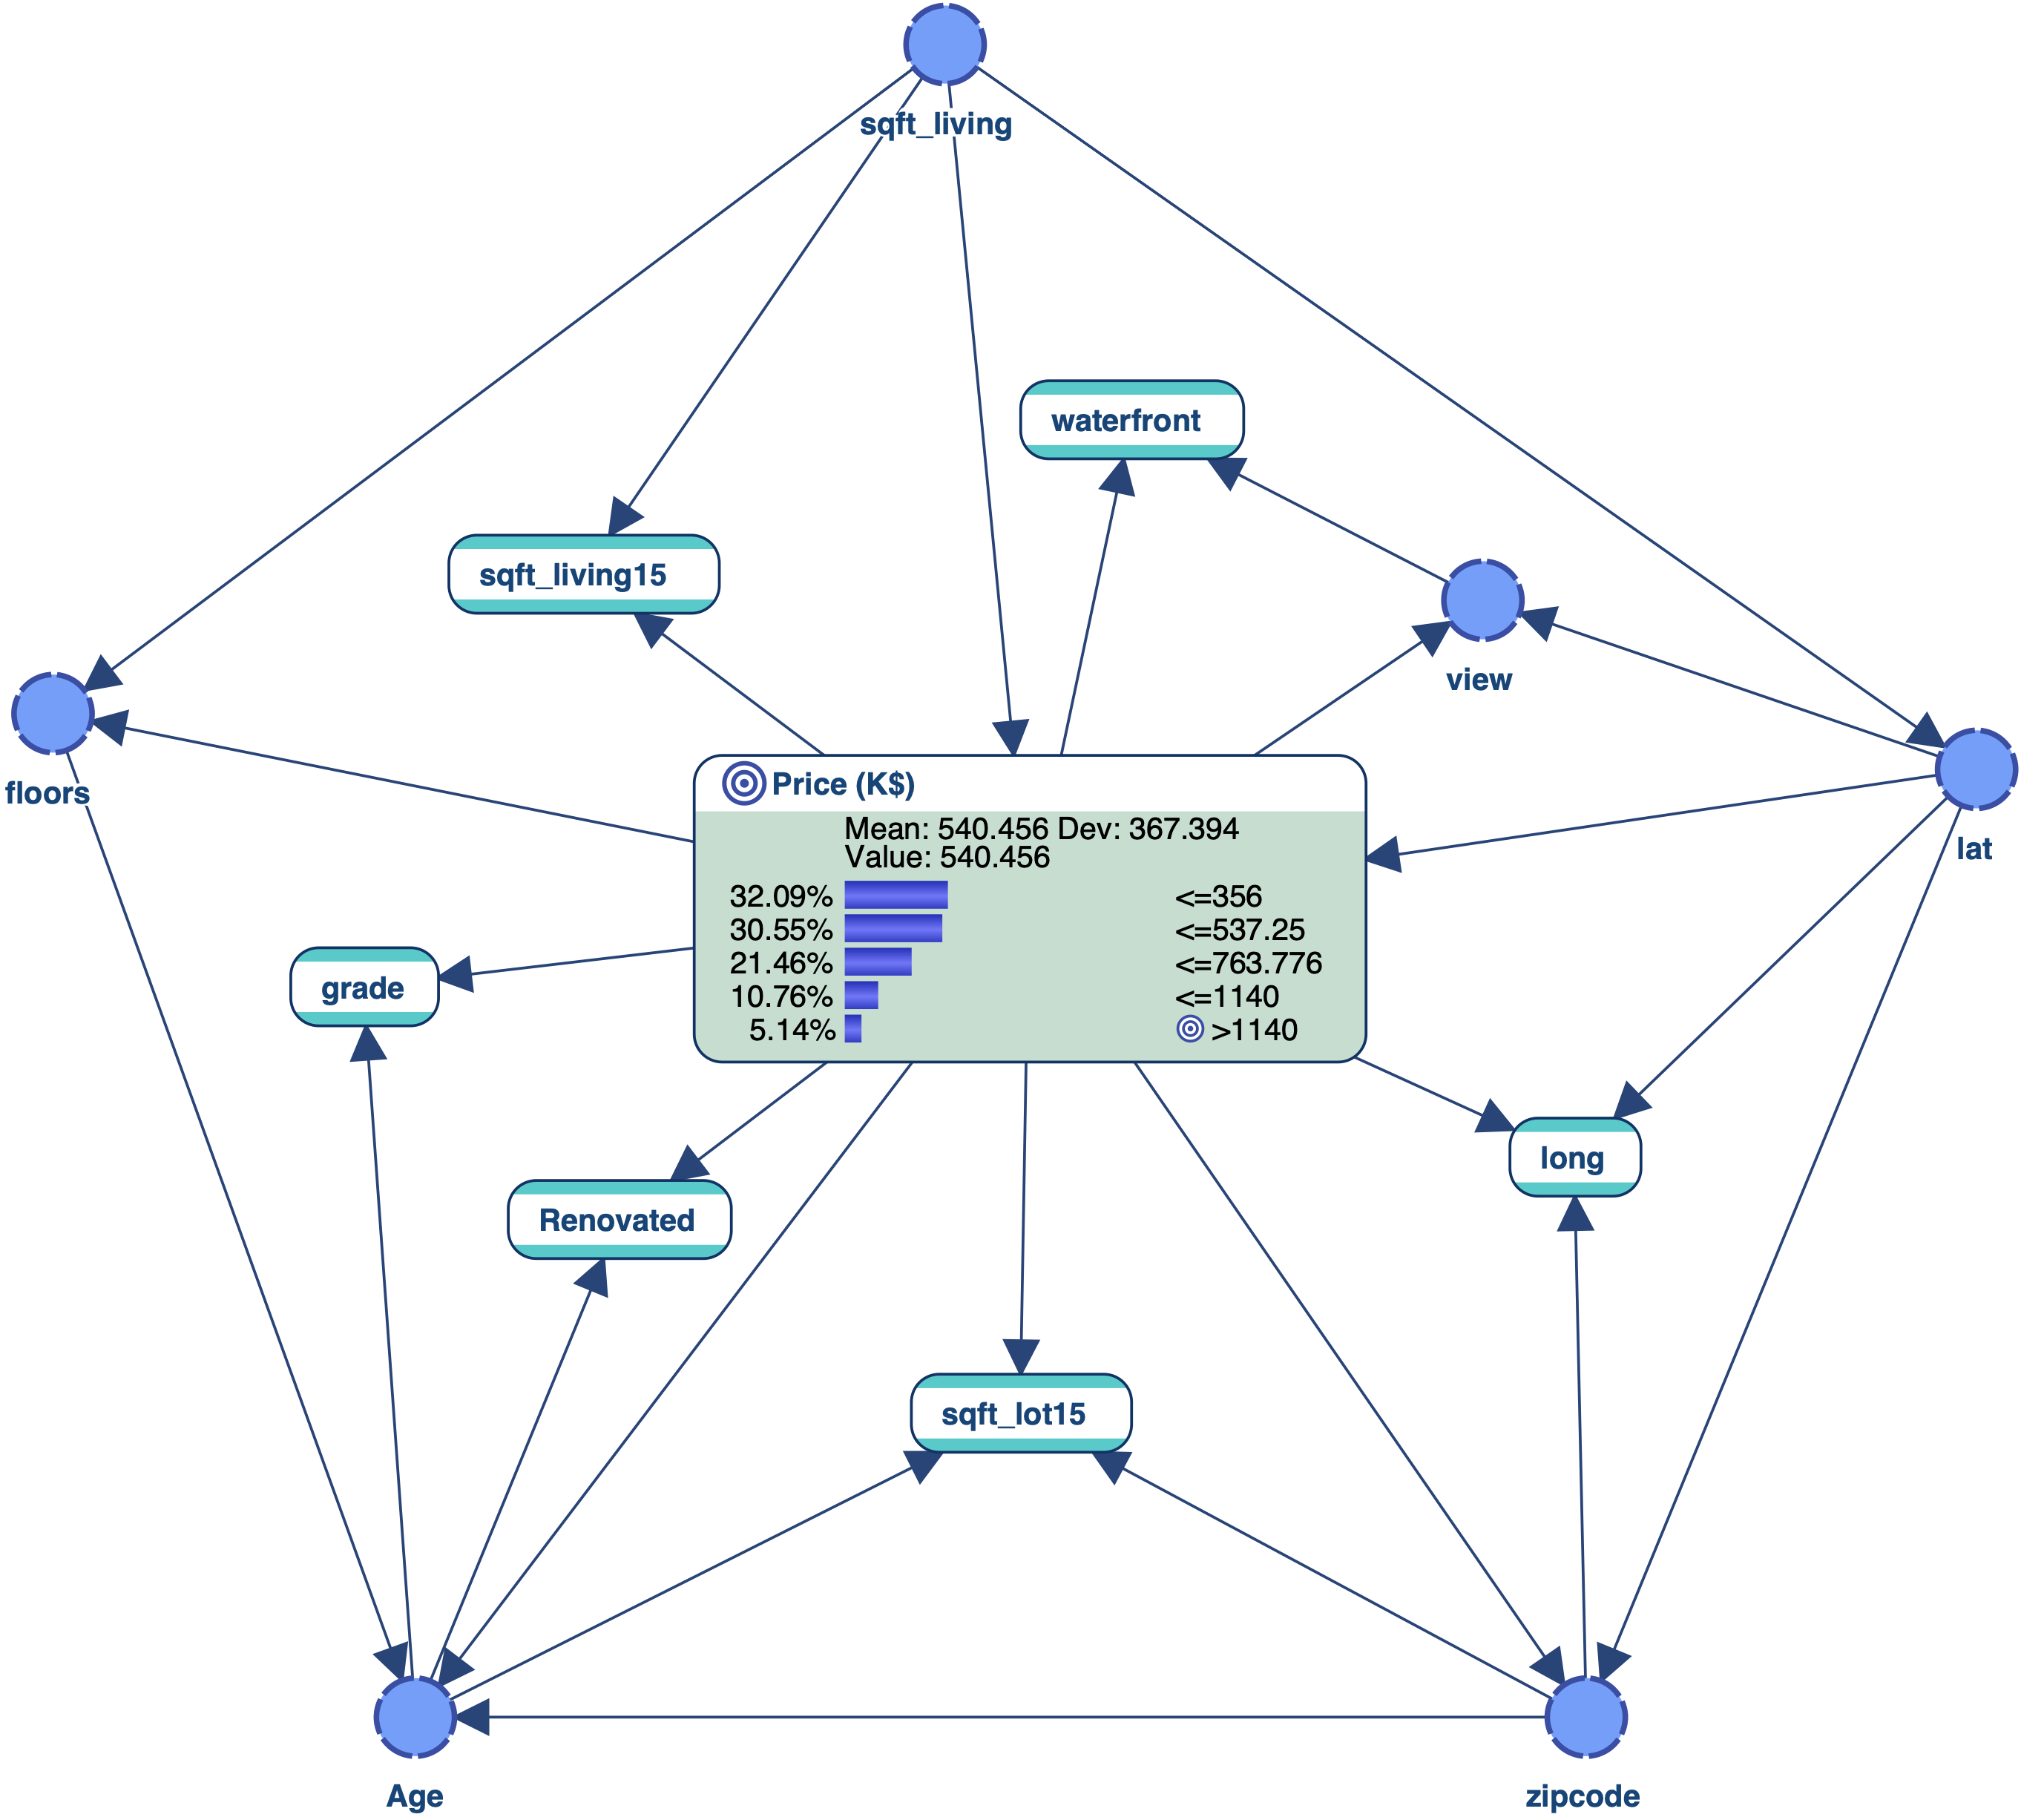
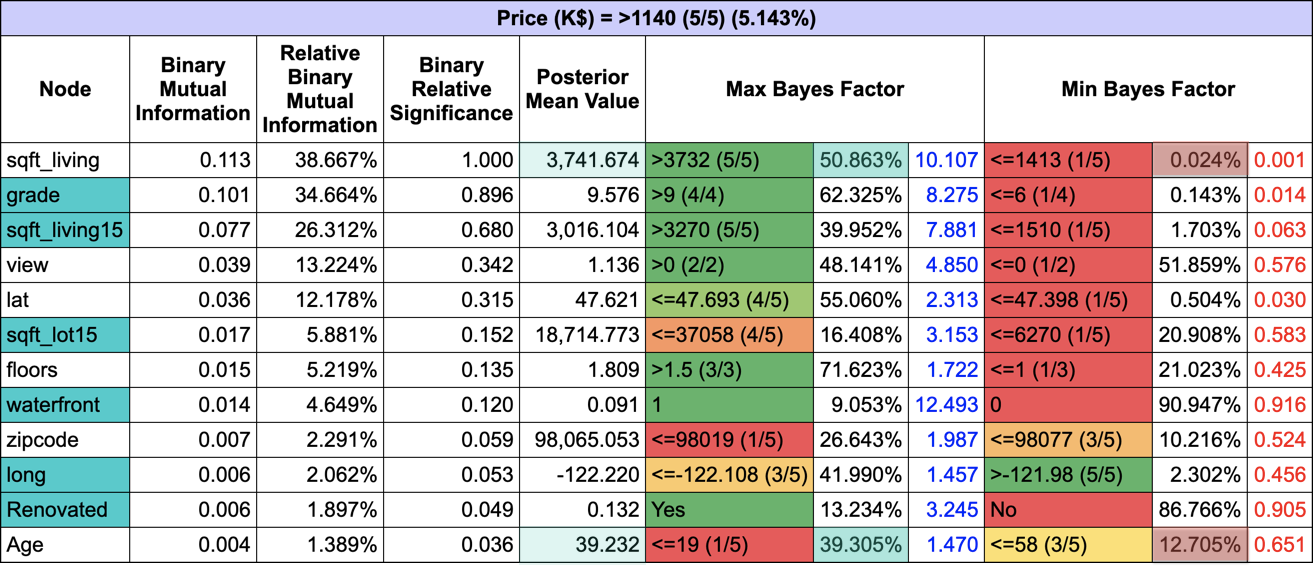
We have highlighted, for the first and last nodes, sqft_living and Age, the metrics that are both in the table and in the monitors below:
- the Posterior Mean Value (light green),
- the posterior probability of the state eM that has the Maximum Bayes Factor BF(eM, s) (green)
- the posterior probability of the state em that has the Minimum Bayes Factor BF(em, s) (red)
New Feature: Color-Coding of the States
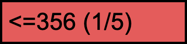
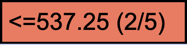
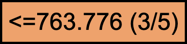
The states are now color-coded in the report tables to allow quick identification of their ranks, from red, for the first state, to green, for the last one.
Example