Variable Clustering (9.0)
Context
Validation Mode | Tool | Resampling | Variable Clustering
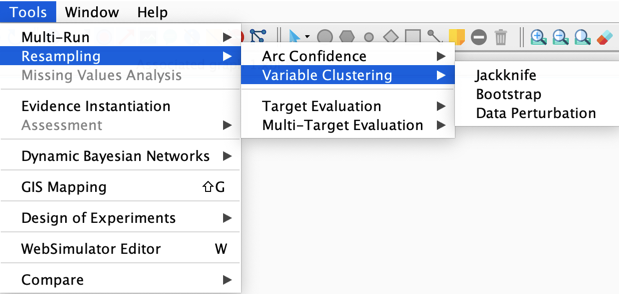
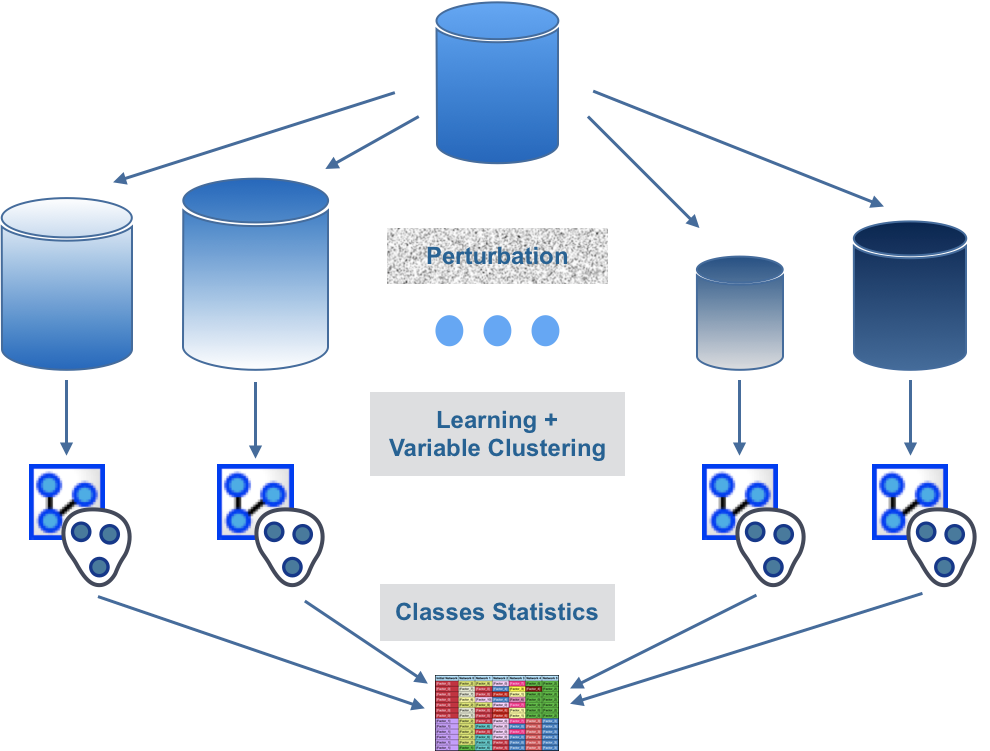
This feature is used to measure the stability of the groups of variables that have been induced with Variable Clustering (opens in a new tab):
- Various data sets are generated from the original data set with one of our resampling methods (opens in a new tab),
- Unsupervised Structural Learning and Variable Clustering (opens in a new tab) are run iteratively on each data set,
- The obtained clusters are compared with those of the current network.
History
This tool has been introduced in version 5.0.4 (opens in a new tab) and updated in versions 5.3 (opens in a new tab) and 7.0 (opens in a new tab).
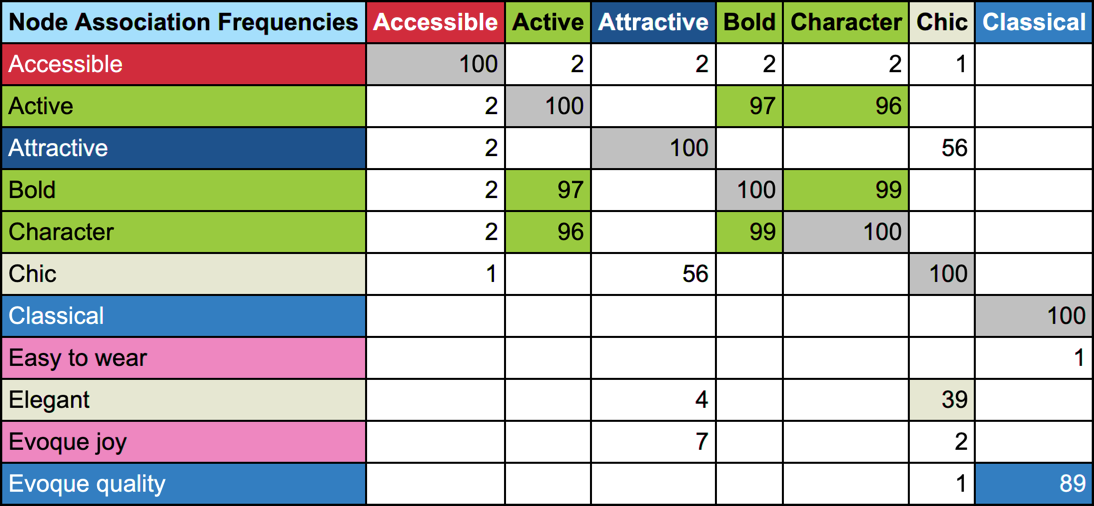
Updated Feature: Variable Clustering Report - Node Association Frequencies
The Node Association Frequencies table returned by the Variable Clustering Report is now color-coded:
- Grey: this indicates the diagonal, with the 100 since the node always belongs in a cluster with itself,
- White: the nodes in the row and column are not Co-Manifest variables, i.e. they do not belong to the same cluster in the original network,
- Other: the nodes in the row and column are Co-Manifest variables, the color is the one of their cluster in the original network.
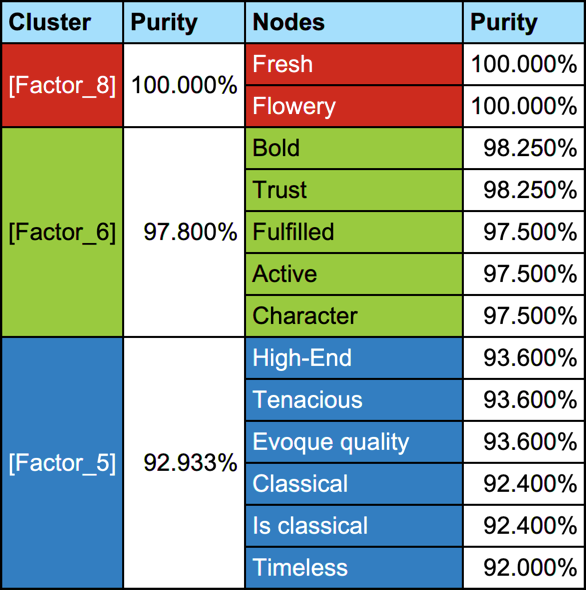
New Feature: Overall and Local Purities
As of version 9.0, the Variable Clustering Report returns an additional table with purities for each cluster and each node:
- The purity of a node is the average of the association frequencies with its Co-Manifest variables,
- The purity of a cluster is the average of the purity of its associated manifest variables.
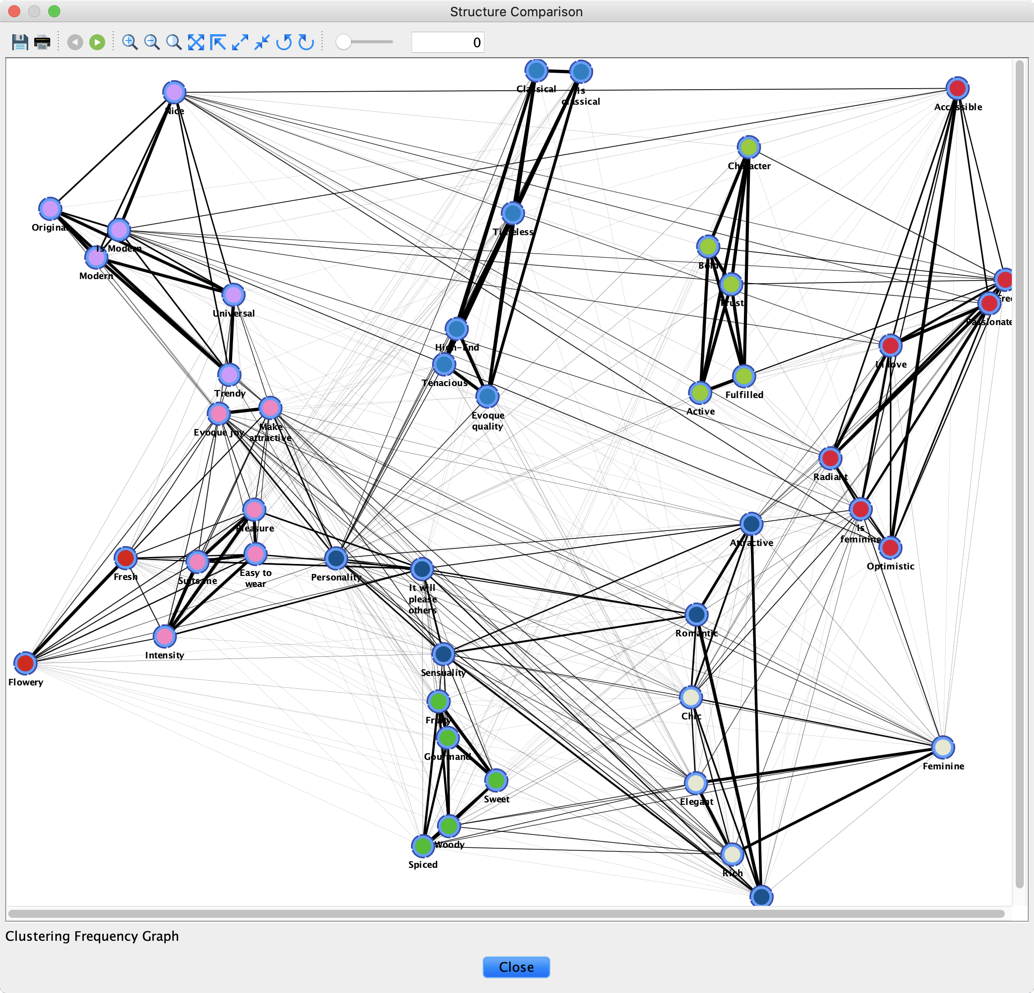
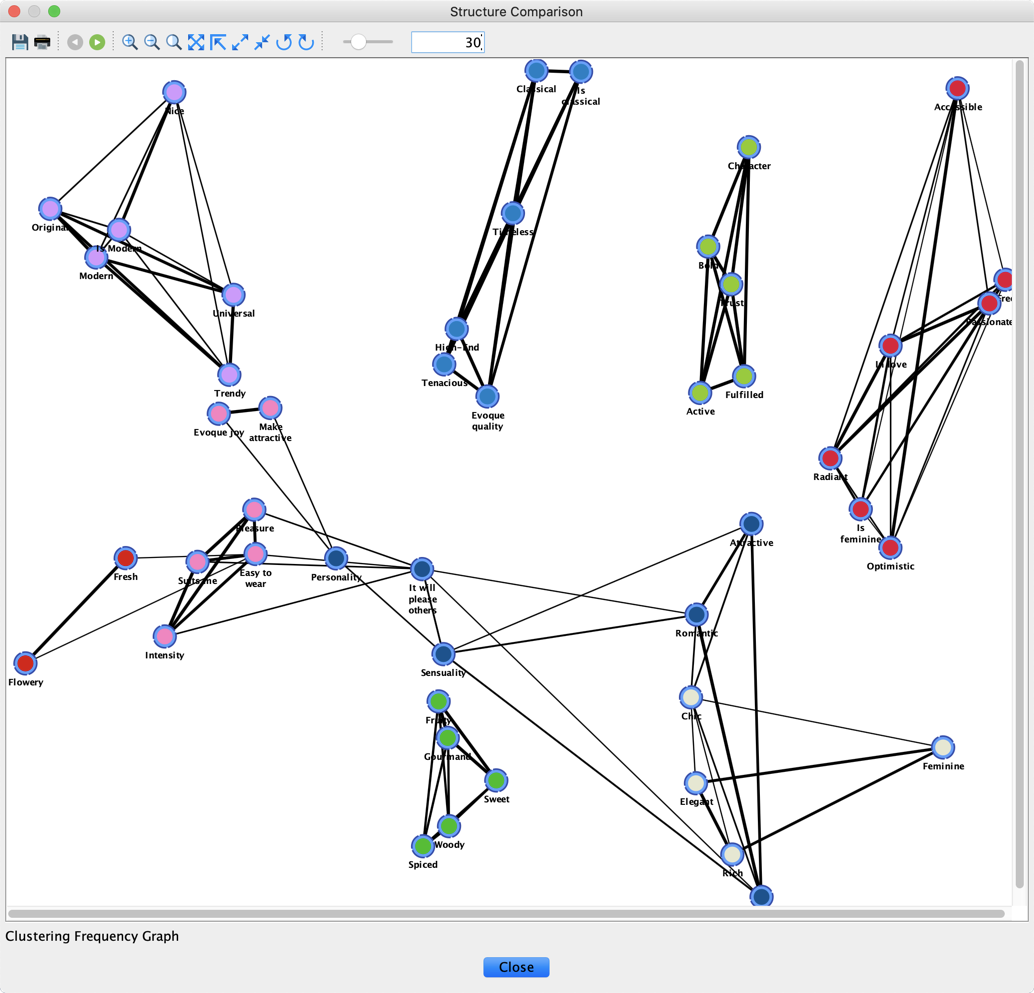
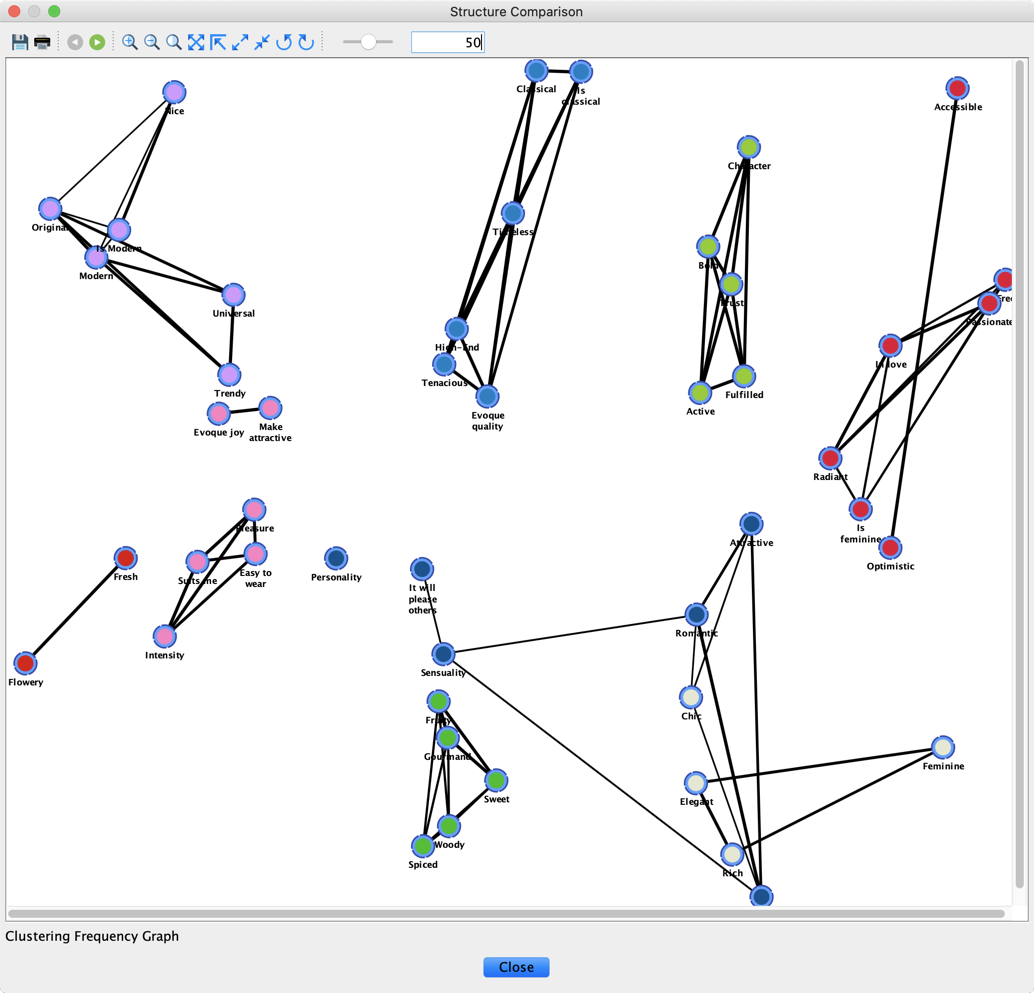
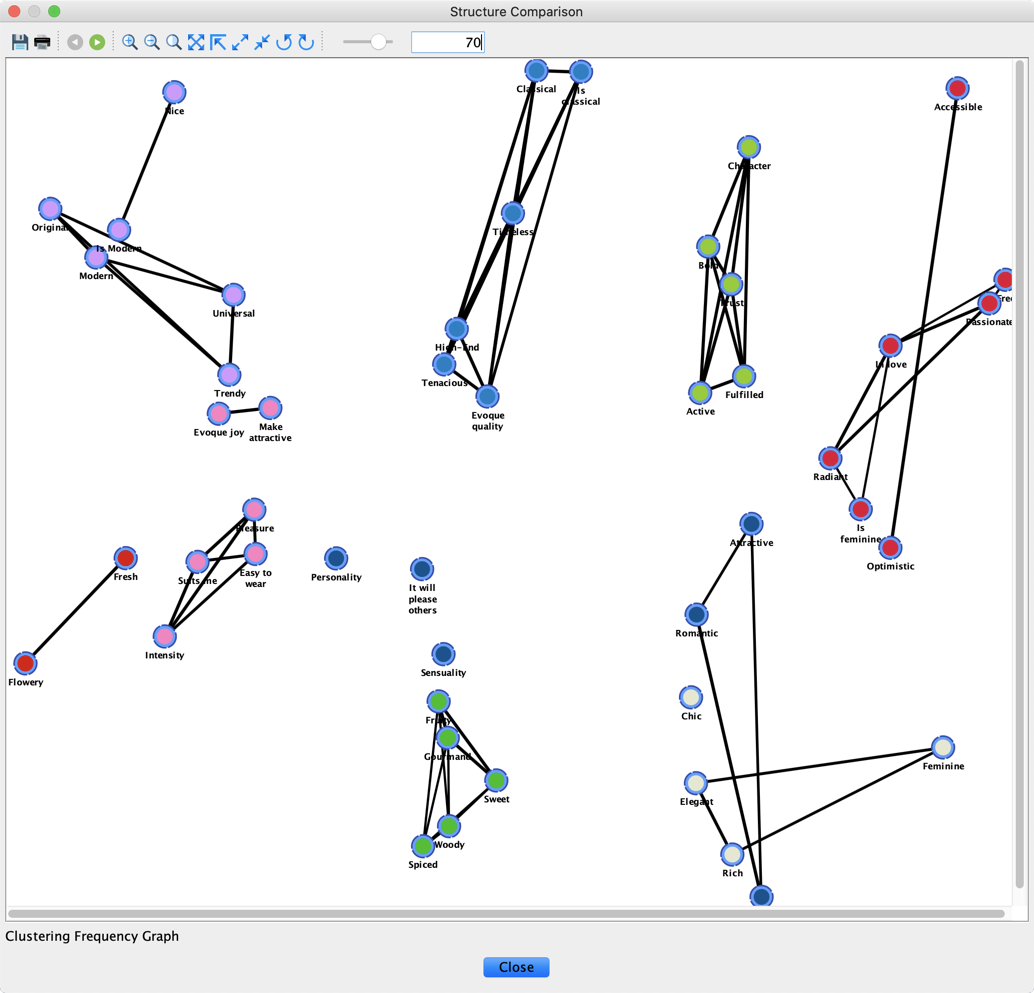
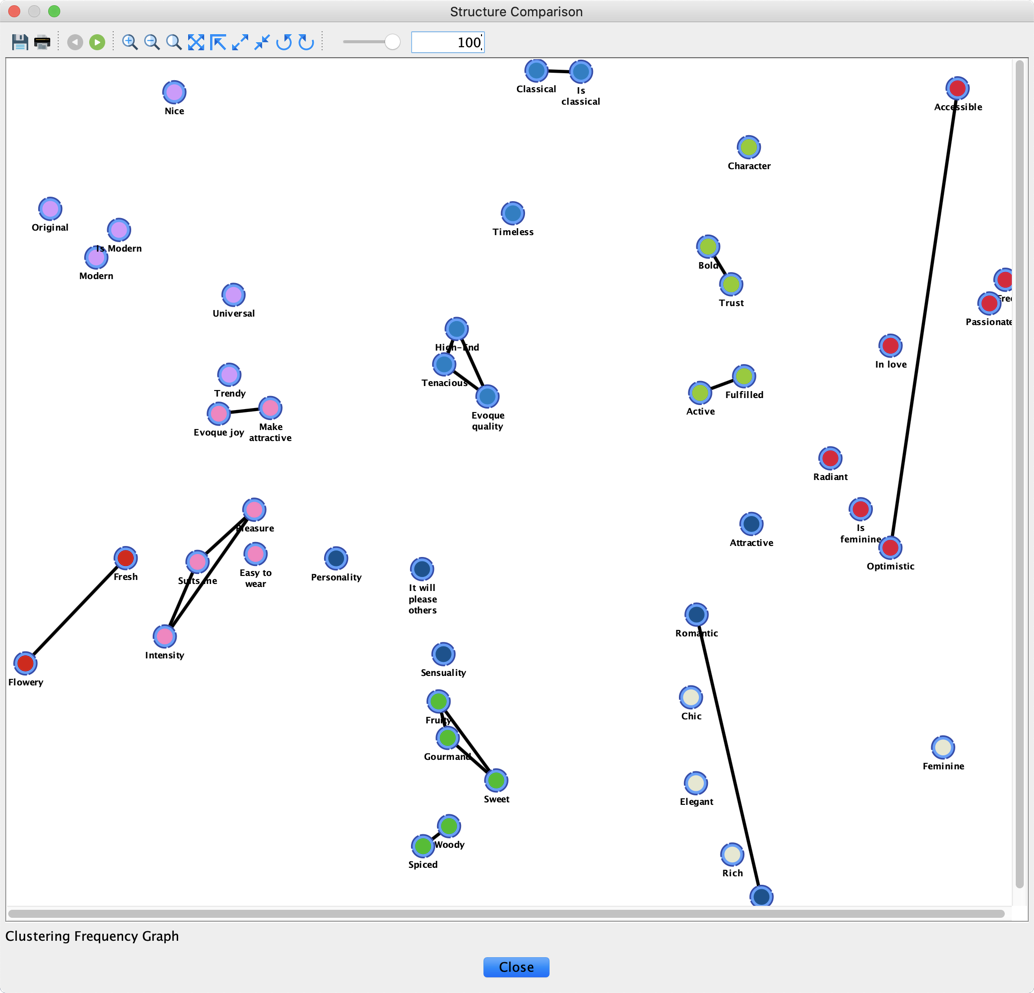
New Feature: Clustering Frequency Graph — Frequency Filter
As of version 9.0, the Variable Clustering Graph is equipped with a slider that allows you to hide the connections that are below the defined frequency threshold.