Webinar Part 2: Analyzing a Collection of Individual Customer Reviews
Recorded on January 30, 2025.
In the second part, we analyze a different type of text relating to a different vehicle. This second text is a collection of individual reviews from 50 new owners of the Thunderbolt X, another made-up model. In these reviews, owners talk about two or three key aspects they liked or disliked about their new Thunderbolt X. Each respondent speaks specifically about their personal experience with this car.
This shift from a synthesized view in Part 1 to individual voices presents a new analytical challenge: uncovering patterns and insights across a diverse array of personal experiences.
In the analysis of Text 2, we do not expect to obtain the same insights as we did for the Solaris 1, because the reviews in Text 2 are specific to the unique features and characteristics of the Thunderbolt X.
Workflow
Text Source for Part 2 of the Webinar
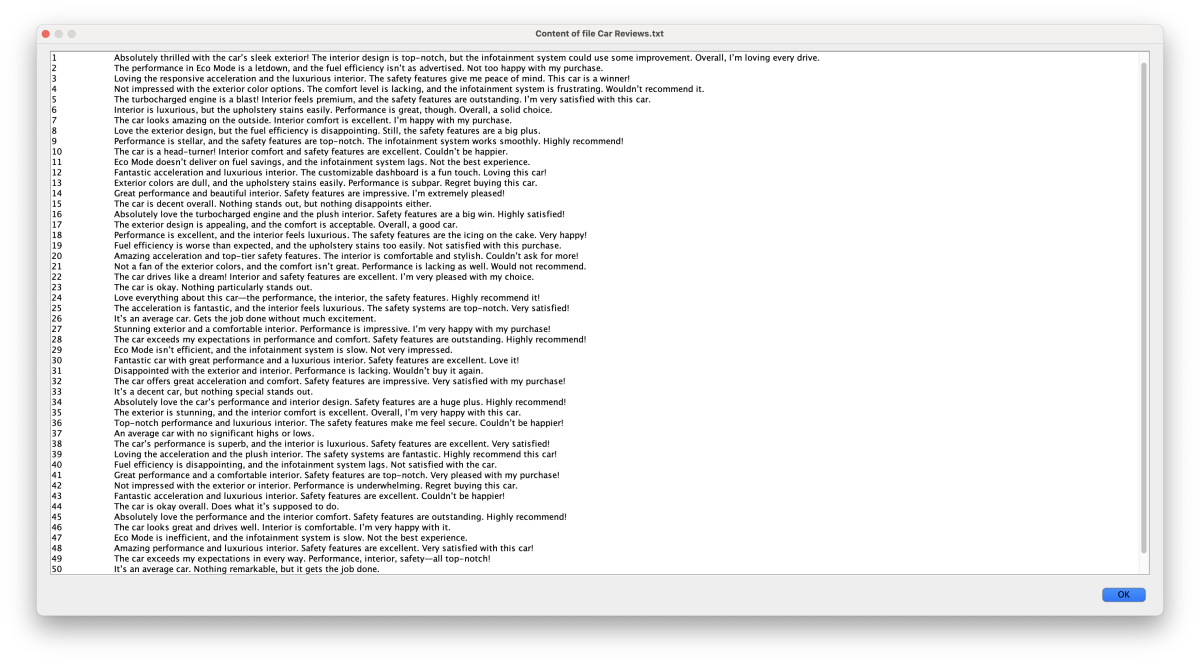
The screenshot below shows a preview of Text 2, which is saved in the file Car Reviews.txt. In Hellixia terminology, this is considered the Knowledge File for the analysis.
To analyze Text 2, we follow the same approach as described in the analysis of the feedback summary in Part 1.
This involves extracting the key dimensions using Hellixia’s Keyword-Based Semantic Mapper, modeling their influence on the Target Node () with the Independence of Causal Influence (ICI) approach, and eliciting both prior probabilities and independent local effects using a brainstorming-like method with multiple LLMs.
While the General Context in Part 1 was set to Text 1, Car Narrative Synthesis, we now update it to Text 2, i.e., 50 Individual User Feedback Entries on Car Evaluations, to reflect the shift in focus.
As the steps are identical to those outlined in Part 1, we do not repeat the explanation and instead focus on the steps relevant to the new text source, Text 2.
Semantic Network with Key Dimensions
The semantic graph below represents the key dimensions extracted from Text 2.

Using Hellixia’s Keyword-Based Semantic Mapper, we automatically identified these dimensions based on the set of customer reviews, generated their embeddings, and applied machine learning to structure the graph using the Maximum Weight Spanning Tree algorithm.
Each node represents a specific dimension of customer feedback, such as Advanced Safety Features, Premium Interior Quality, or Superior Performance, while the connections between nodes illustrate their semantic relationships (correlations), based on proximity in the embedding space.
This graph provides a visual and thematic organization of the key aspects users highlighted, creating a foundation for further causal modeling and analysis.
Building a Hierarchical ICI Model
With the key dimensions extracted and structured into a semantic graph, we now move to the next phase of the analysis: constructing a Hierarchical Independence of Causal Influence (ICI) Model. This approach allows us to quantify how each dimension, individually and through thematic groups, influences the target node, .
In this hierarchical model, we introduce latent variables to represent thematic categories identified in the semantic graph, such as , , , and . Each dimension contributes to its respective latent variable, which, in turn, affects the target node.
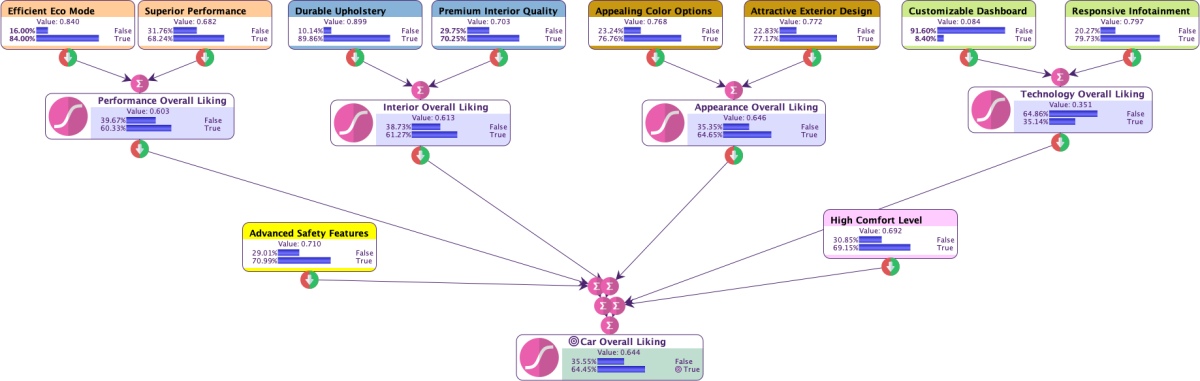
This layered structure enables a more intuitive and interpretable representation of the relationships between user feedback dimensions and overall satisfaction.
The Tornado Graph below, based on the learned Hierarchical ICI Model, illustrates the impact of each factor on .
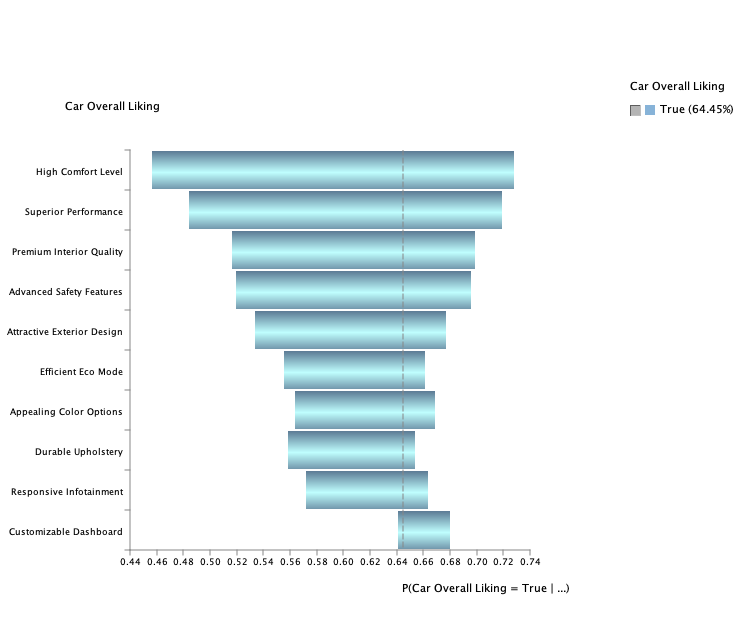
The emerges as the strongest driver, followed closely by and . and also contribute significantly to overall satisfaction. In contrast, appears as a “nice-to-have” feature, as it only increases the likelihood of overall liking.
Sentiment Analysis: Exploring User Emotions
We conclude Part 2 of the webinar with a sentiment analysis of the 50 individual customer reviews.
Using Hellixia’s Keyword-Based Semantic Mapper, we focus on the keyword Emotions to extract and organize the emotional dimensions expressed in the feedback.
This process generates the semantic graph below, which highlights the sentiments users associate with different aspects of the car, such as excitement, satisfaction, frustration, or disappointment.

These emotions are not independent. However, we proceed to create an ICI model to better understand their local effects on overall satisfaction. We then create our Target Node, , and build the model to quantify the influence of each emotional dimension. By estimating the priors and local effects, we derive insights into how specific emotions impact overall satisfaction.
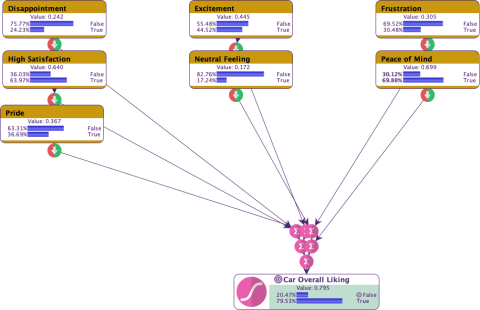
The Tornado Graph below illustrates the individual effects of emotions on , highlighting that and are the most important drivers.
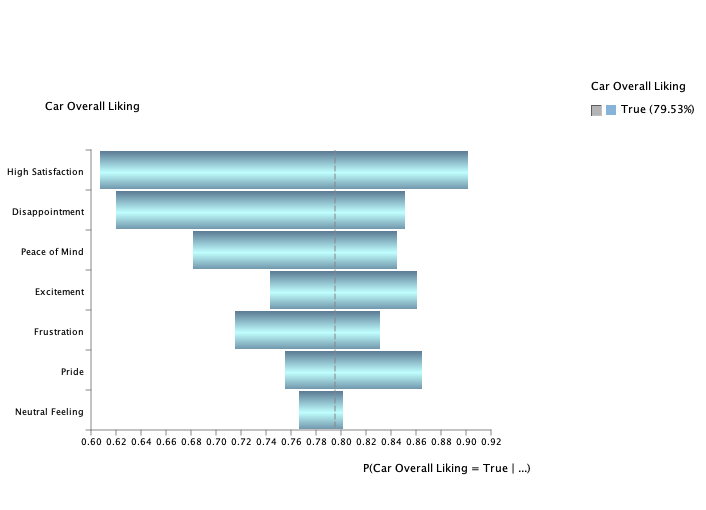
The Quadrant Chart offers a complementary perspective by categorizing emotions based on their probability (mean value) and causal impact (effect size). Each emotion is represented by a triangle, with its orientation indicating the direction of its effect: upward-pointing triangles signify positive effects (e.g., and ), while downward-pointing triangles indicate negative effects (e.g., and ).
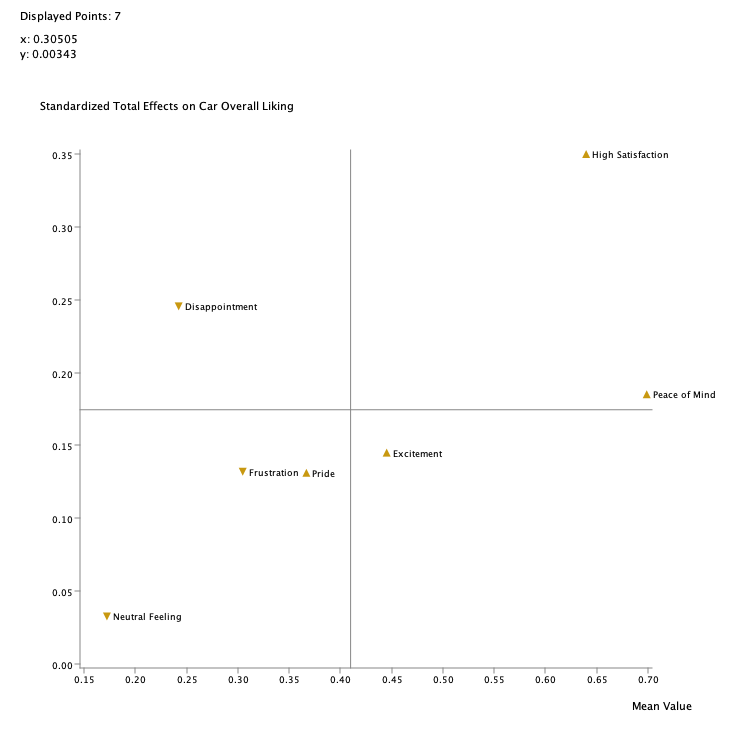
Together, the Tornado Graph and Quadrant Chart provide a comprehensive view of how emotional dimensions, their frequencies, and their directions of influence shape customer perceptions and satisfaction.