Atopic Dermatitis
Atopic Dermatitis, commonly known as eczema, manifests as red, itchy, and occasionally painful rashes, affecting both children and adults to varying degrees.
This section examines atopic dermatitis as a domain involving genetic, environmental, and immunological factors. Hellixia is used to generate causal Bayesian networks that organize candidate cause-and-effect relationships for review.
Semantic and Hierarchical Semantic Networks
We first perform a semantic analysis of the domain to identify the main concepts, variables, and relationships.
We create the node “Atopic Dermatitis” and then go through our usual workflow for creating a semantic network and then a hierarchical semantic network (see previous sections, e.g., Hamlet) to perceive the semantic landscape surrounding atopic dermatitis and lay the foundations for a deeper understanding of its underlying dynamics.
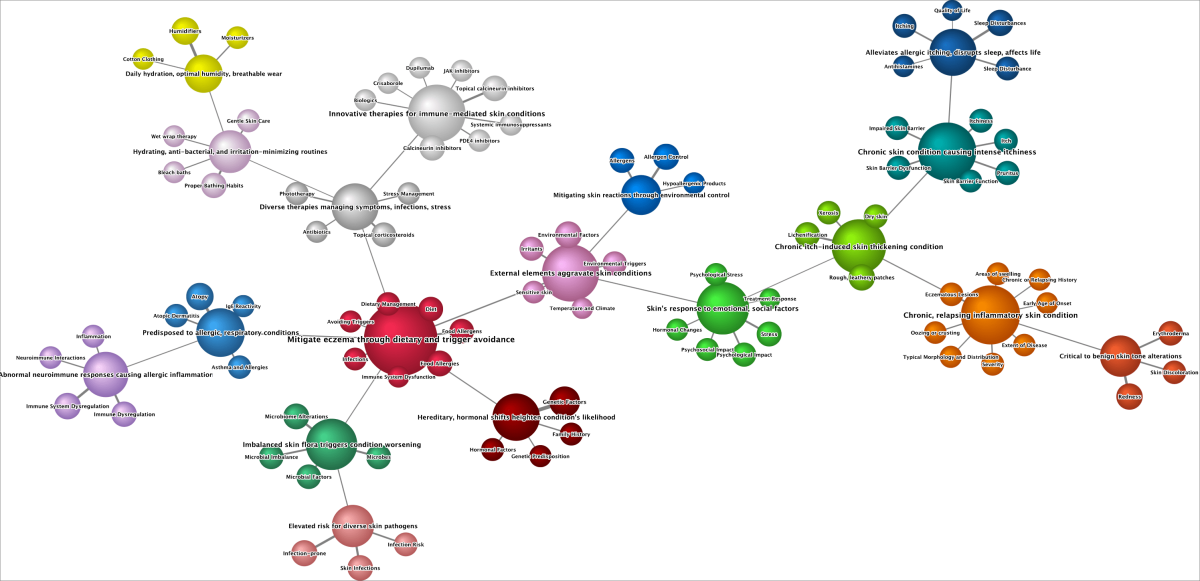
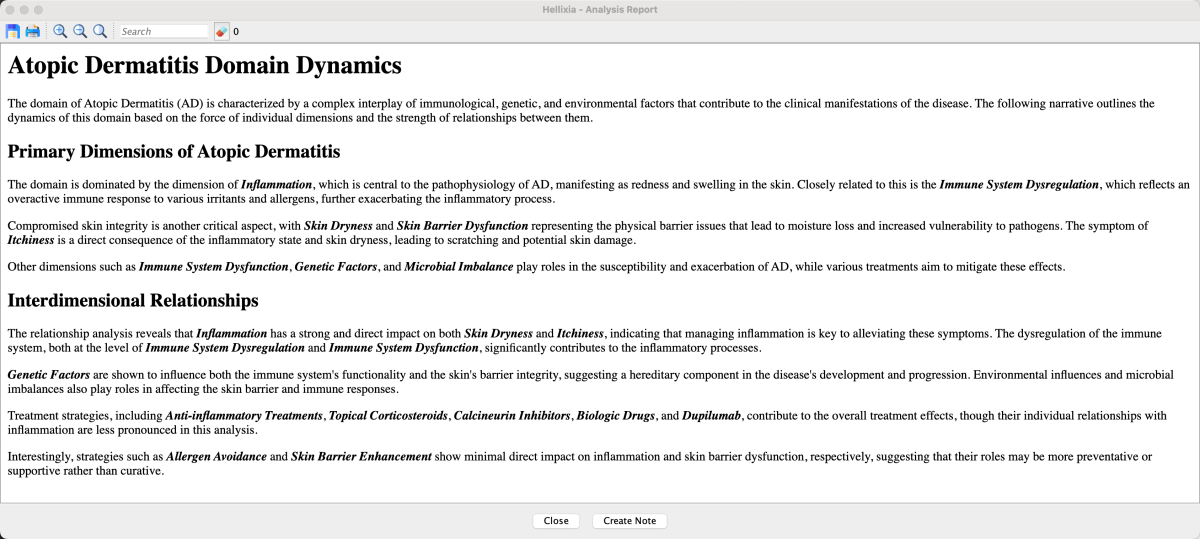
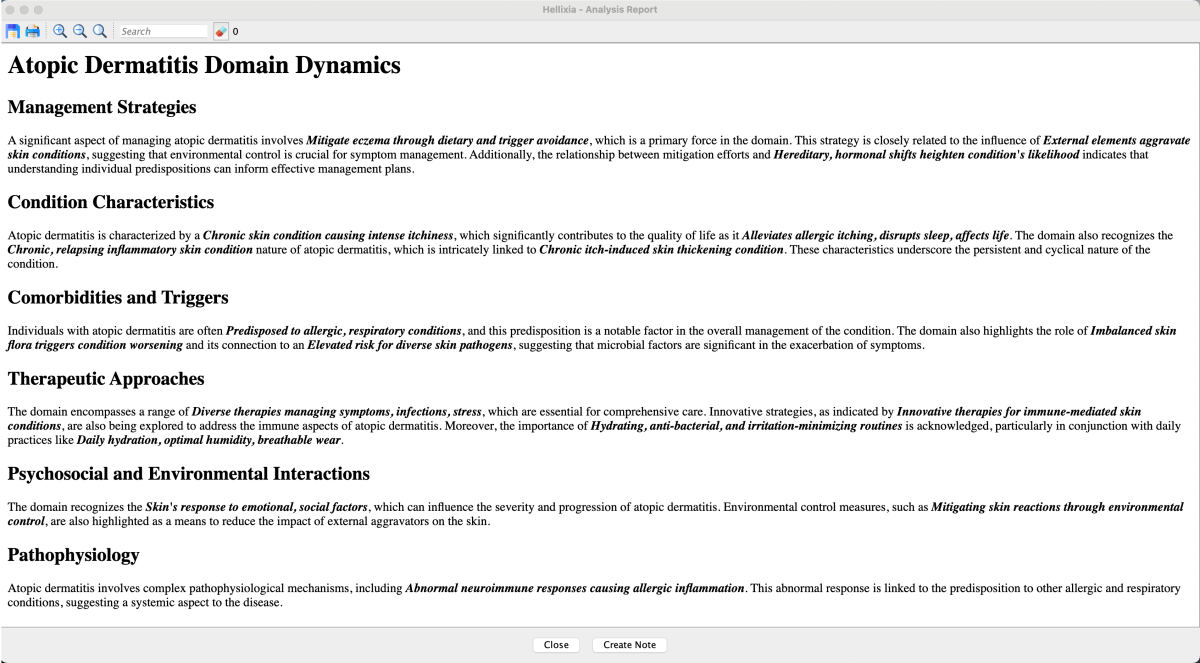
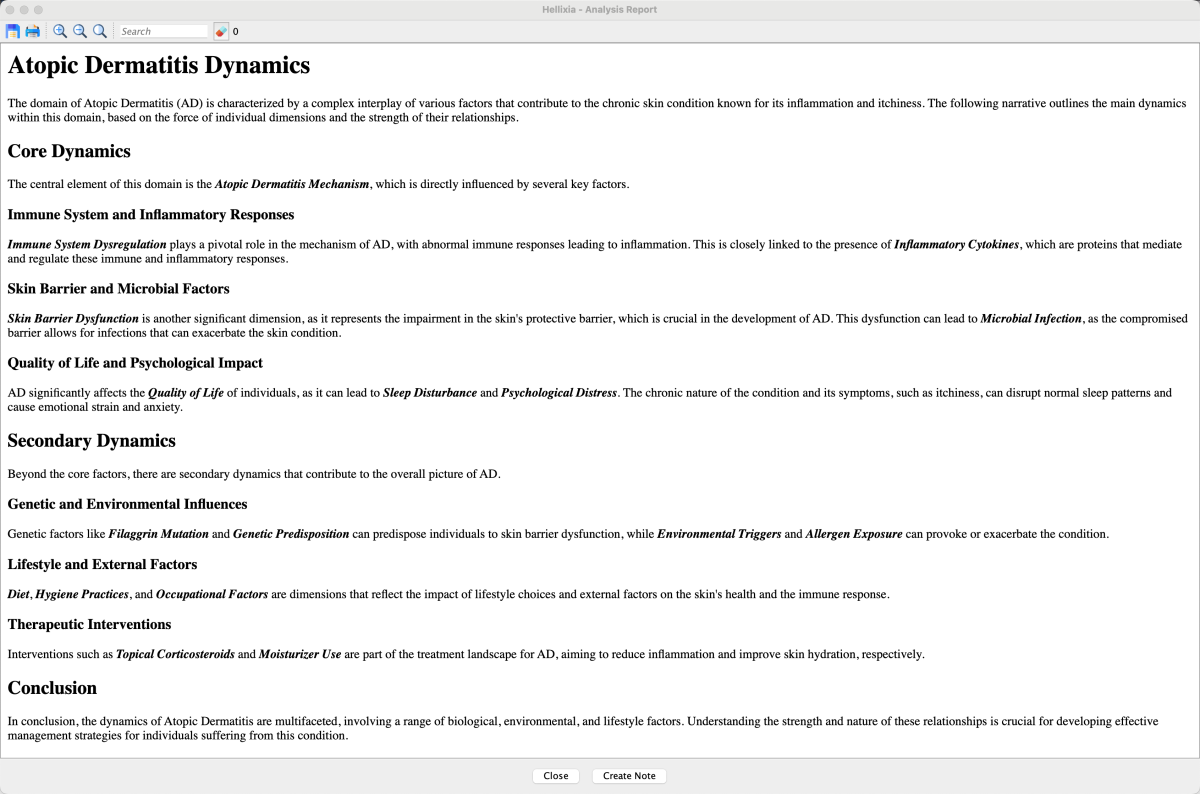
We finally select the factors only (i.e., we focus on the higher level of this hierarchical network), and use the Hellixia Report Analyzer to generate a concise summary of the Relationship Analysis Report.
Causal Network Generator
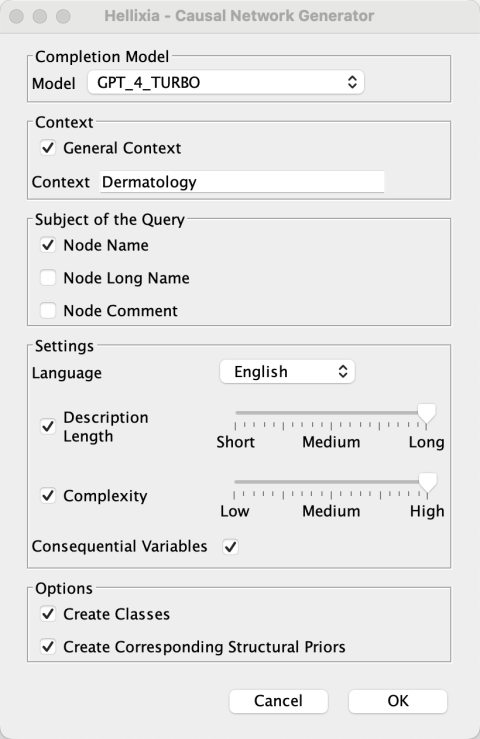
Having gained an overall understanding of the domain through semantic networks, we now move on to the construction of Causal Bayesian Networks using Hellixia’s new capabilities that will be released in BayesiaLab 11.2.
Atopic Dermatitis Mechanism
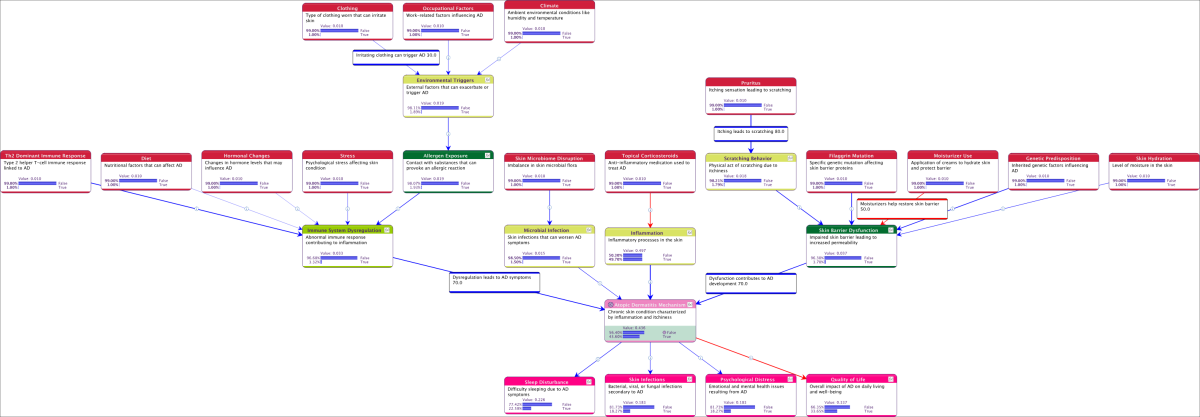
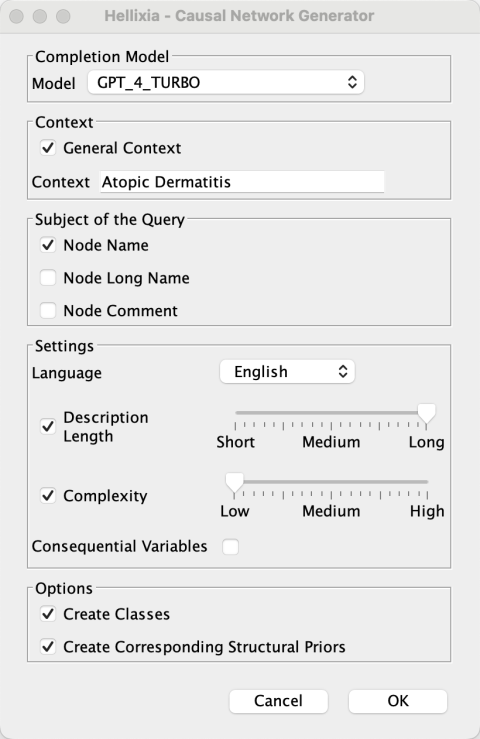
Create a node called “Atopic Dermatitis Mechanism”, then select the Causal Network Generator feature.
After one or two minutes (the prompt is quite complex), review the fully specified Causal Bayesian Network: graph and probabilities. This network is characterized by causally oriented arcs, each accompanied by a concise explanation of the causal relationship and an estimate of the causal effect, scaled between -100 (shown in red) and 100 (shown in blue).
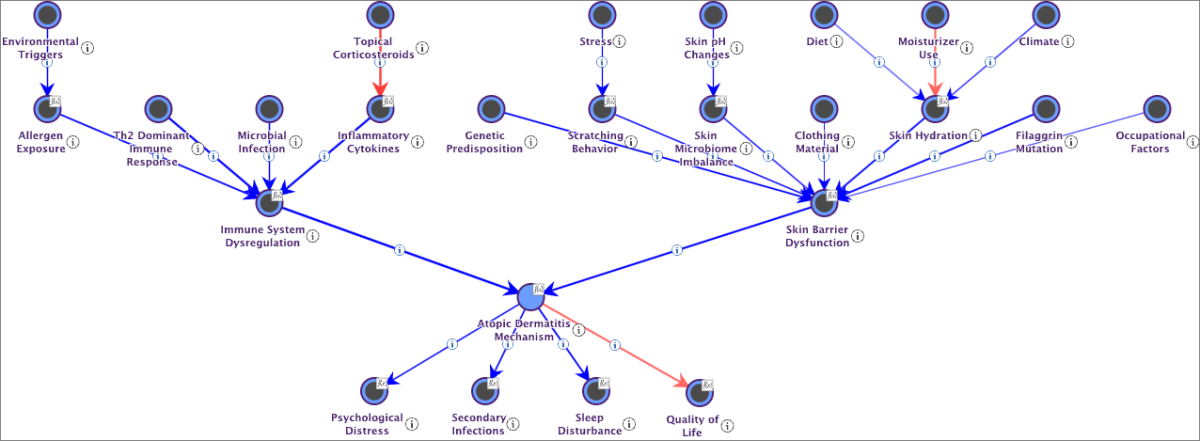
Translate these causal effects into conditional probability tables using the new BayesiaLab formula DualNoisyOr(), specially designed to integrate positive and negative effects between Boolean variables.
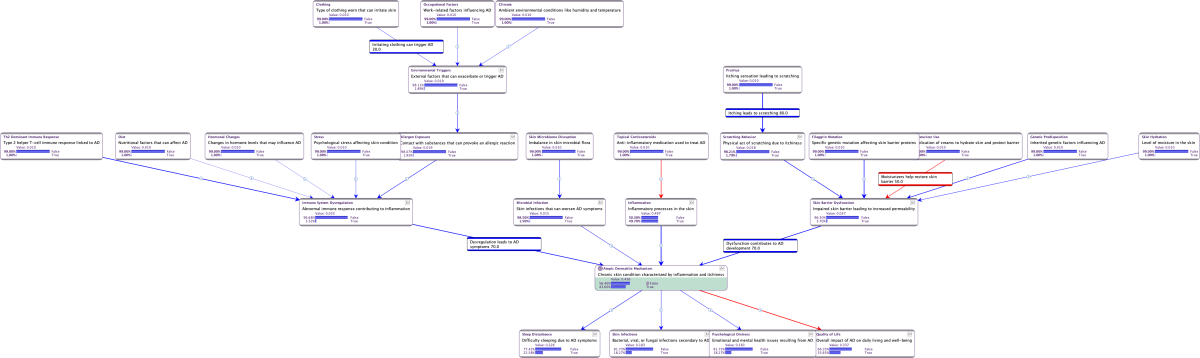
Naturally, the networks generated by Hellixia MUST undergo rigorous evaluation by Subject-Matter Experts. This verification is crucial not only from a qualitative point of view to ensure that the network accurately represents real causal relationships but also from a quantitative point of view to confirm the relevance of the suggested causal effects.
Microbial Infection
Next, examine the underlying causes of “Microbial Infection.” Select the corresponding node in the network and proceed to the Causal Network Generator.
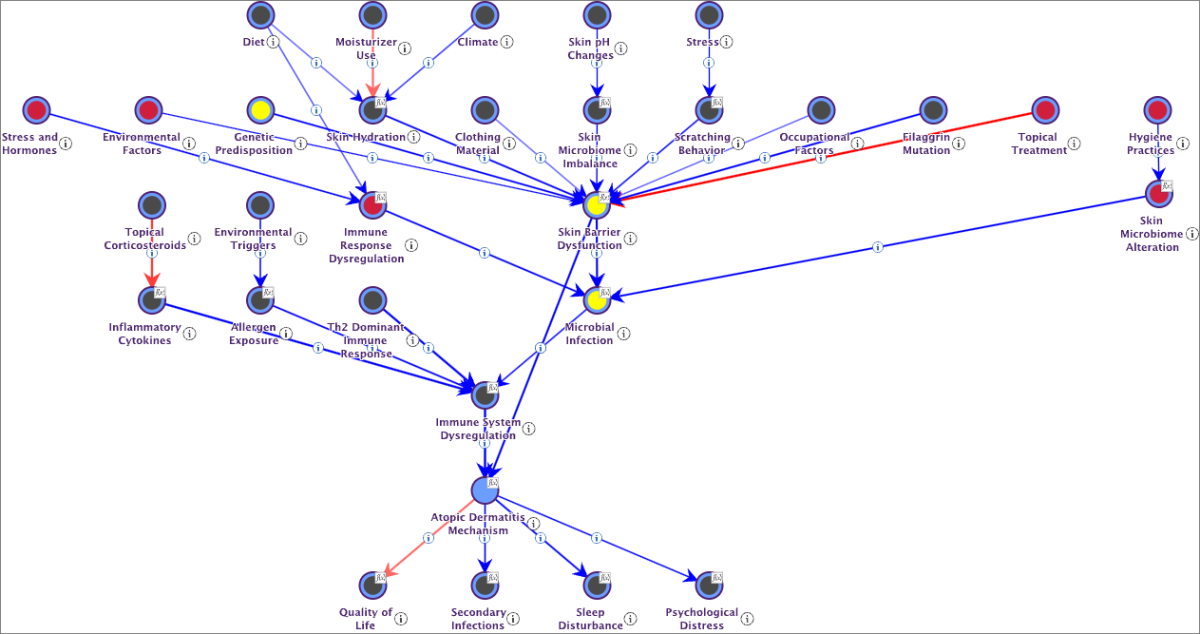
Review the generated causal network, which shows the expanded view with detailed aspects of Microbial Infection. The yellow nodes are common to both the original and expanded networks, the grey nodes represent the original network nodes only, and the red nodes indicate the newly added dimensions specific to microbial infection.
Finally, use the Hellixia Report Analyzer to generate a concise summary of the (Causal) Relationship Analysis Report.
Causal Relationship Finder
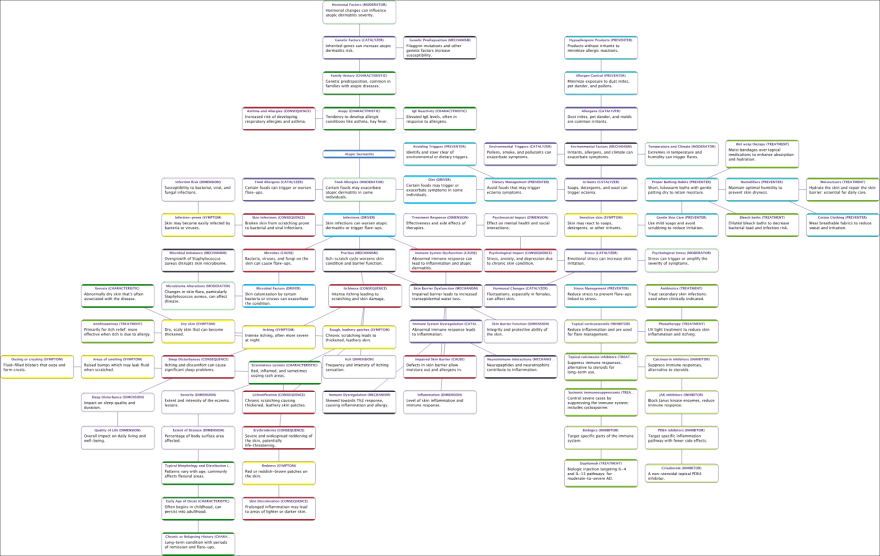
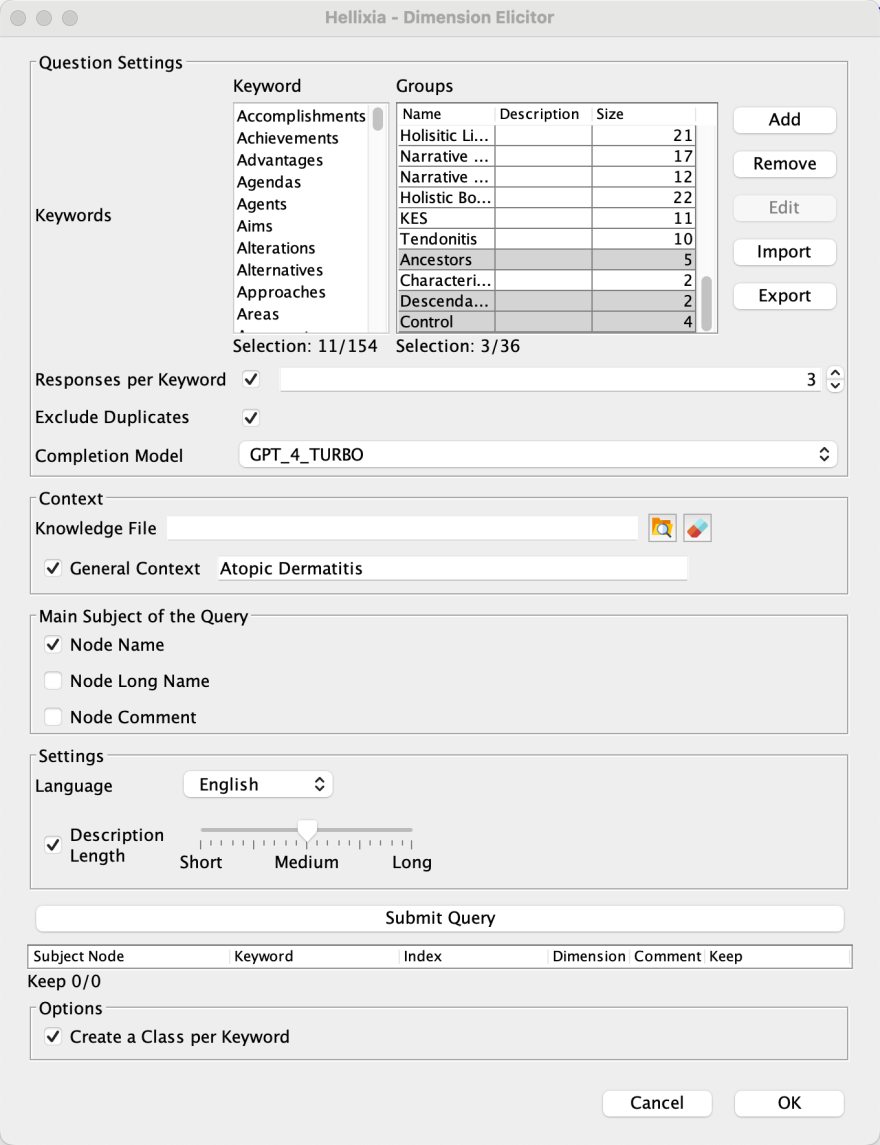
Adopt a different workflow to construct a Causal Network for Atopic Dermatitis. Start by using Hellixia’s Dimension Elicitor to identify relevant dimensions.
Select a range of keywords to guide the Dimension Elicitor process in Hellixia, encompassing various aspects of the domain under study. These keywords include ‘Accelerators,’ ‘Catalyzers,’ ‘Causes,’ ‘Drivers,’ ‘Mechanisms,’ ‘Consequences,’ ‘Symptoms,’ ‘Inhibitors,’ ‘Moderators,’ ‘Preventers,’ and ‘Treatments.’
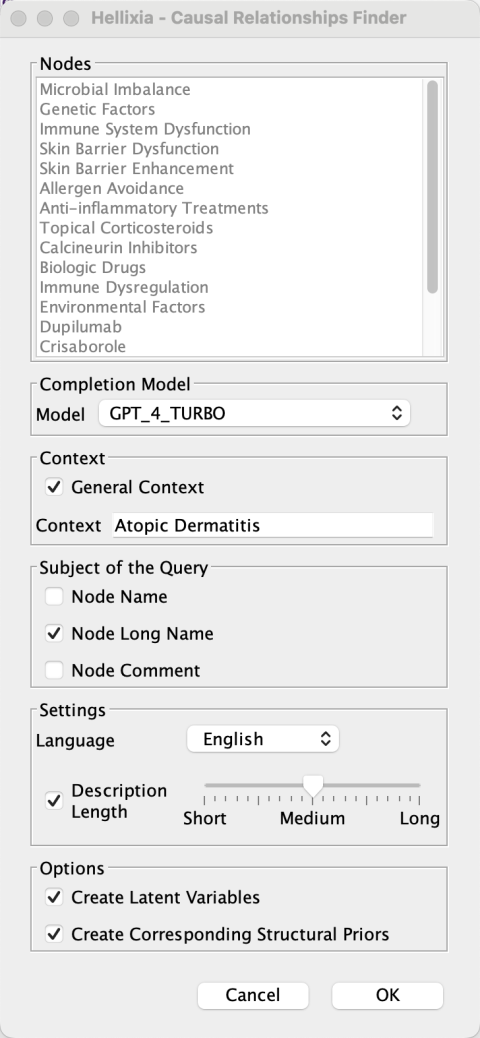
With these nodes generated, diverge from the usual practice of generating embeddings for semantic networks. Instead, use Hellixia’s Causal Relationships Finder feature to automatically create a Causal Network based on the selected nodes.
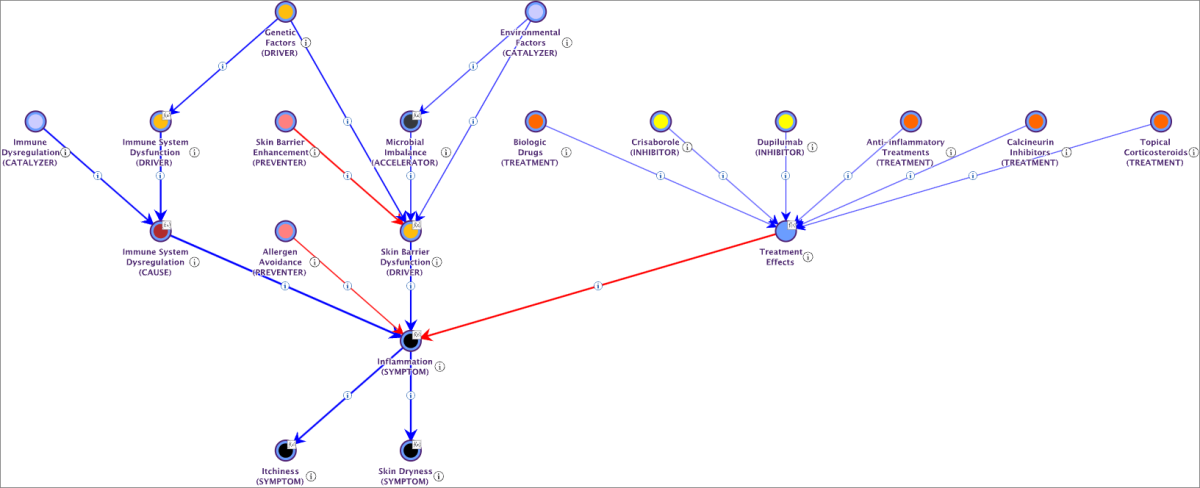
Run the Causal Relationships Finder on the nodes elicited for the Atopic Dermatitis Mechanism. This tool examines potential causal connections among these nodes and, if required, generates latent variables to enhance the network’s explanatory power.
Review the resulting network. Similar to the Causal Network Generator, the tool does more than identify causal links; it also quantifies the causal effects, which are represented on a scale ranging from -100 (indicated in red) to 100 (indicated in blue).
Conclude the section by using the Hellixia Report Analyzer, which generates a concise summary of the (causal) Relationship Analysis Report for this latest network.