Continuous Nodes
Context
- In BayesiaLab, the Continuous Node type implies that each numerical value of the underlying variable is assigned to one of several intervals (or bins), i.e., the variable is represented in a discretized form in the Continuous node.
- All of the Continuous node’s intervals cover the entire range of values (or domain) of the underlying variable.
- On the Graph Panel, a Continuous Node appears as a solid blue disc with a dashed outline .
- The “breaks” in the outline symbolize the fact that Continuous nodes are always discretized, i.e., “broken” into bins.
Usage
-
Compared to Discrete Nodes, the Node Editor for Continuous Nodes shows several different options.
-
The different treatment is due to the fact that each state in a Continuous Node represents intervals of values. So, many of the functions are related to viewing and editing those intervals.
-
Within the
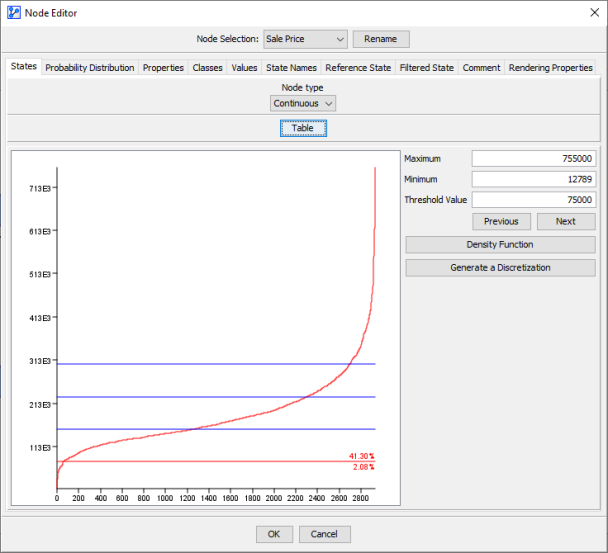
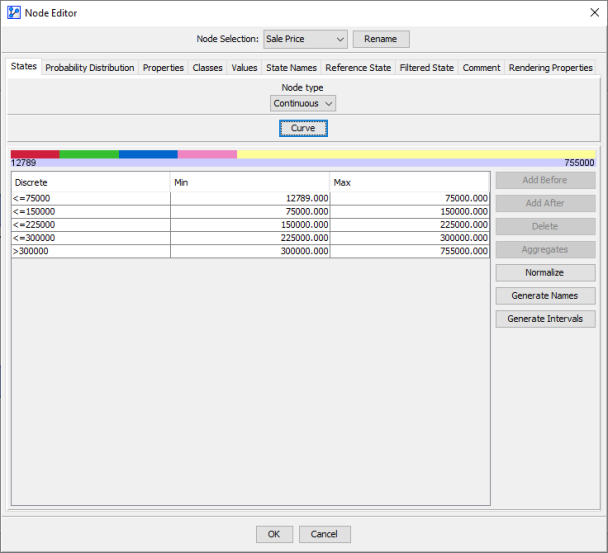
Statestab, there are two main views for editing the intervals of a Continuous Node: -
Table View, available for nodes with and without associated data.
-
Curve View, only available for nodes with associated data.