Probabilistic
Whereas the arcs connecting nodes make up the qualitative part of a Bayesian network by defining direct probabilistic dependencies, conditional probability distributions constitute the quantitative part, i.e., the type and strength of the probabilistic relationships. Such distributions are most commonly represented in the form of Conditional Probability Tables (CPTs), which allow representing every possible discrete conditional probability distribution.
Conditional Probability Table
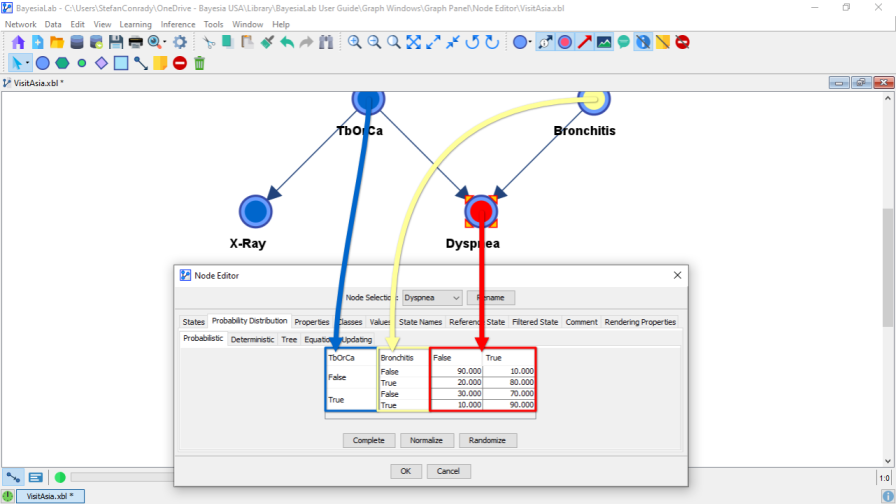
Within the Probability Distribution tab of the Node Editor, the Probabilistic tab reveals the Conditional Probability Table (CPT) of the selected node.
Reading and interpreting the CPT is straightforward. We illustrate it with the familiar Visit Asia network.
- The left part of the CPT shows all the combinations of the states of the parent nodes, and . So, in this example, we have two parent nodes.
- Of course, the left part only exists if the node in question has at least one parent node.
- Without parent nodes, there would only be an (unconditional) Probability Table.
- The right part of the CPT shows the probability distribution of the child node, , conditional on the states of the parent nodes. To represent a valid distribution, the sum of the probabilities in a row must be equal to 100%. Accordingly, we can read the first row of the CPT in the screenshot below: Given that and , the probability of is 90%, and the probability of is 10%.
Editing the Conditional Probability Table
Since CPTs represent all interactions between the parents, their size grows exponentially with the number of parents and, thus, editing the table manually can be challenging. As a result, learning CPTs from data is the preferable approach provided that data is available.
However, in the context of constructing Bayesian networks from expert knowledge, editing the CPTs directly becomes necessary.
Basic Editing
The Node Editor provides a number of editing features that can help manage even large tables efficiently:
- All numbers shown in the Node Editor are percentages. So, a probability of 0.9 would be entered as 90.
- You can paste probabilities into the CPT from external applications, such as spreadsheets.
- You can copy the CPT from the Node Editor and paste it into external applications in various formats, e.g., plain text, HTML, bitmap image, or a vector image format.
- You can move the columns of the parent node, so the table arrangement matches the way you think about the domain.
- You can select individual cells by clicking on them, or you can select multiple cells by clicking on column or row headers.
- Clicking on a cell while you hold Shift selects all cells from the active cell to the clicked cells.
- Clicking on a cell while holding
Ctrladds the clicked cell to the current selection. - Clicking on a selected cell while holding
Ctrlremoves the clicked cell from the selection. - Entering a value while cells are selected applies the entered value to all selected cells.
Complete
As each row in the CPT must sum to 100%, the Complete function fills in the selected cell or cells without probabilities to achieve a row sum of 100%.
If multiple cells are used for completion, the probability residual is evenly distributed between the cells. If the current row sum exceeds 100%, Complete sets all empty cells to 0.
Normalize
If all cells in the row are already filled, clicking the Normalize button produces a distribution that sums to 100% so that it reflects the relative weight of the original values in the cells. For instance, if the original values in the cells were , the new normalized distribution would be .
If there are any empty cells in the row, Normalize fills in the blank cells like the Complete function. So, applying Normalize on produces the distribution .
Randomize
Clicking Randomize produces a random distribution for the selected cells based on the residual probability of the row. So, given a row consisting of the cells , i.e., with the two blank cells, the probability residual of 50 would be randomly divided between the blank cells. A possible result could be , for instance. Note that this function is only useful for prototyping and testing purposes.
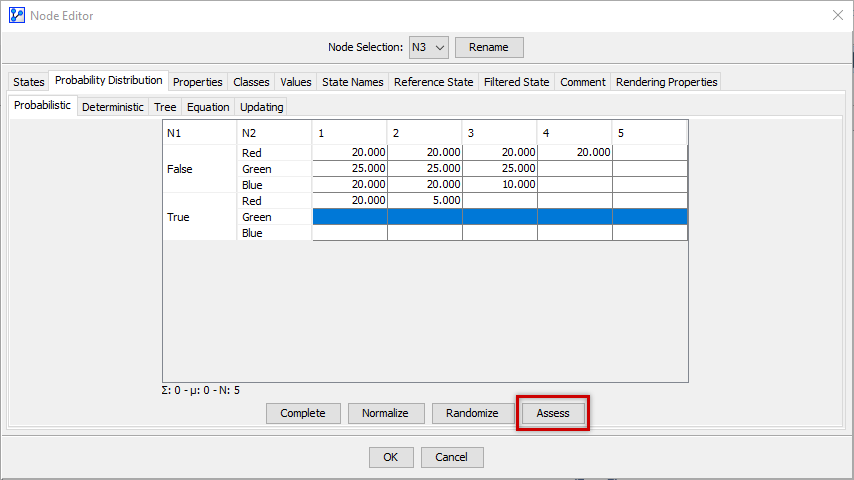
Assess
Compared to the previous functions, Complete, Normalize, and Randomize, the Assess function plays a very different role.
In fact, unless you have Experts defined in the context of using the Bayesia Expert Knowledge Elicitation Environment (BEKEE), the Assess button will not be visible on this tab. We show it here for the sake of completeness, but defer a detailed discussion to the BEKEE User Manual.