Car Accidents
Car accidents are influenced by a wide range of factors, including driver behavior, vehicle conditions, infrastructure, and the environment. This example uses Hellixia to construct Causal Bayesian Networks for analyzing accident-related risks.
This method constructs a causal network that explains the underlying mechanisms contributing to a specific criterion, such as the probability of a car accident. By identifying direct and indirect causal factors, this approach helps to reveal the interactions and probabilities that drive accident occurrence.
The second approach focuses on a Causal-Centric view, where the chosen criterion (e.g., car accidents) is treated as the main risk. This approach organizes the analysis around five distinct groups of dimensions:
Sub-risks associated with the main risk (car accidents), detailing specific situations that may lead to accidents.
Variables that initiate Events, identifying what might cause sub-risks to manifest.
Factors that can prevent or reduce the probability of Triggers causing Events.
Direct impacts of Events, such as injuries or property damage resulting from car accidents.
Variables that lessen or mitigate the severity of Consequences.
Both approaches organize causal assumptions about car accidents in a reviewable model. The example shows how Hellixia creates Causal Bayesian Networks and Risk-Centric Causal Bayesian Networks that can be inspected and refined in BayesiaLab.
Causal Bayesian Network
Go to the BayesiaLab Startup Page and select the Automatic Causal Network Generator tool.
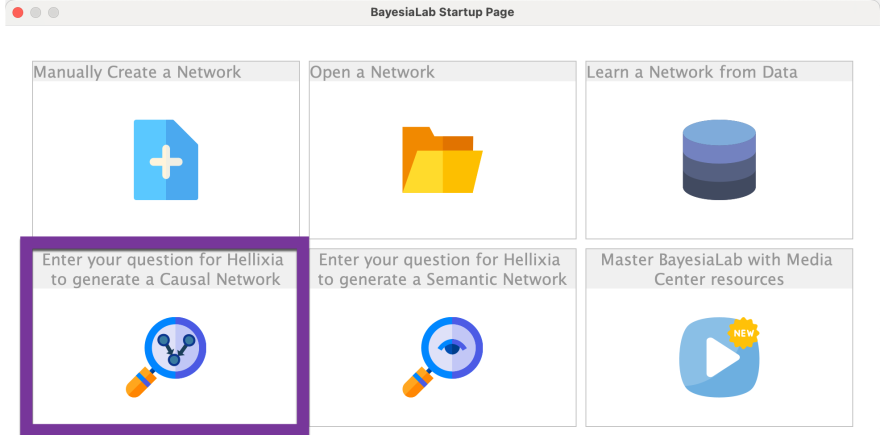
Enter the main topic Car Accidents, for example using the microphone , and select Advanced Mode.
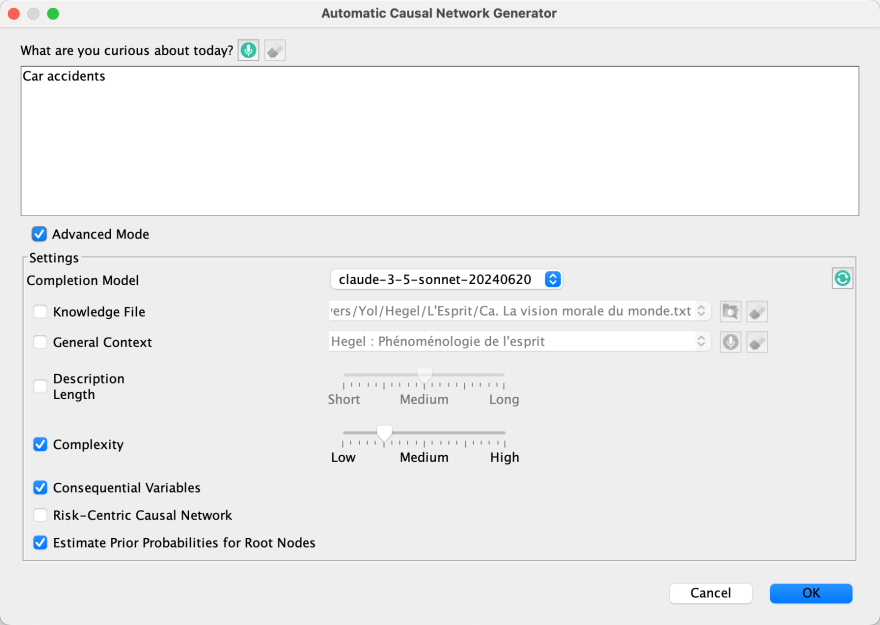
Select the completion model, in this case Claude Sonnet. Choose a low complexity setting, include consequential variables, and enable the estimation of prior probabilities for the root nodes. Within seconds, Hellixia generates a fully specified Causal Bayesian network, complete with both the graph and probabilities.
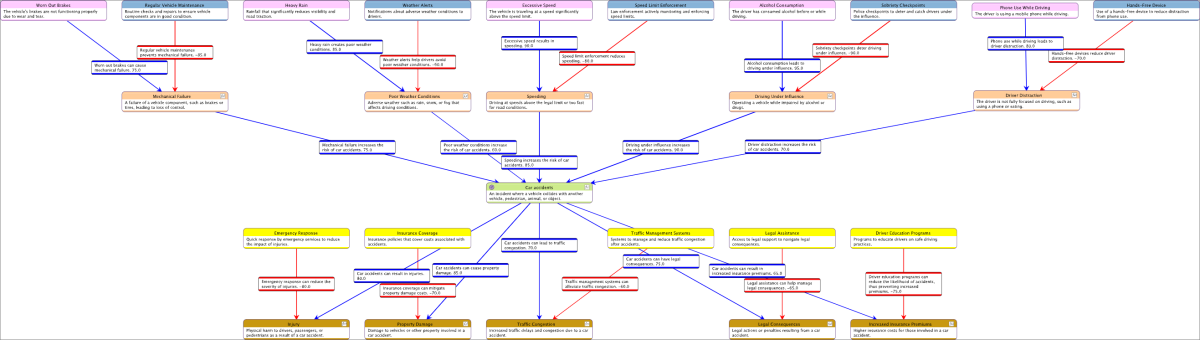
Review the generated network. It consists of Boolean nodes and directed arcs that represent causal relationships. It displays 5 events (orange nodes), 3 interventions (green nodes), 2 aggregates (yellow nodes), 1 confounding variable (Time of day), and 3 consequential variables (blue nodes). Each arc includes a brief explanation of its causal link, along with an estimated effect, ranging from -100 (displayed in red) to 100 (displayed in blue). The negative and positive effects are incorporated into the DualNoisyOr() function of the child nodes. Additionally, each root node has an estimated prior distribution.
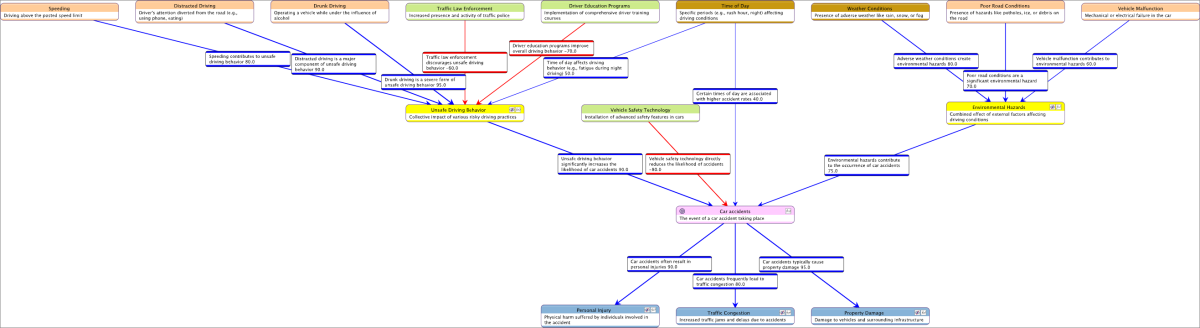
Inspect the Tornado graph (Analysis > Visual > Target > Target's Posterior > Tornado Diagrams > Total Effect) to evaluate the impact of events and intervention variables on the probability of a car accident.
Risk-Centric Causal Bayesian Network
We will now create a risk-centric causal network, with car accidents considered as the main risk.
Go to the BayesiaLab Startup Page, select the Automatic Causal Network Generator tool, and then select Advanced Mode to check the Risk-Centric option.

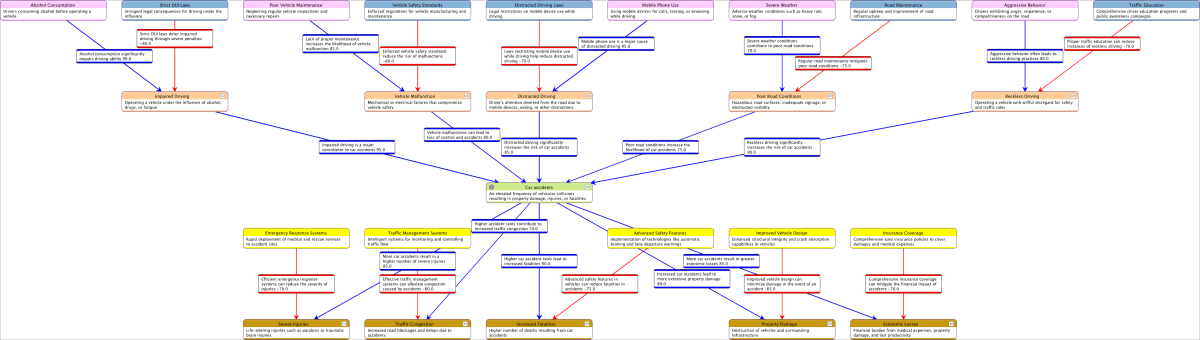
Review the generated structure, which includes triggering variables (pink nodes), control variables (blue nodes), events (orange nodes), consequences of car accidents (brown nodes), and mitigants (yellow nodes).
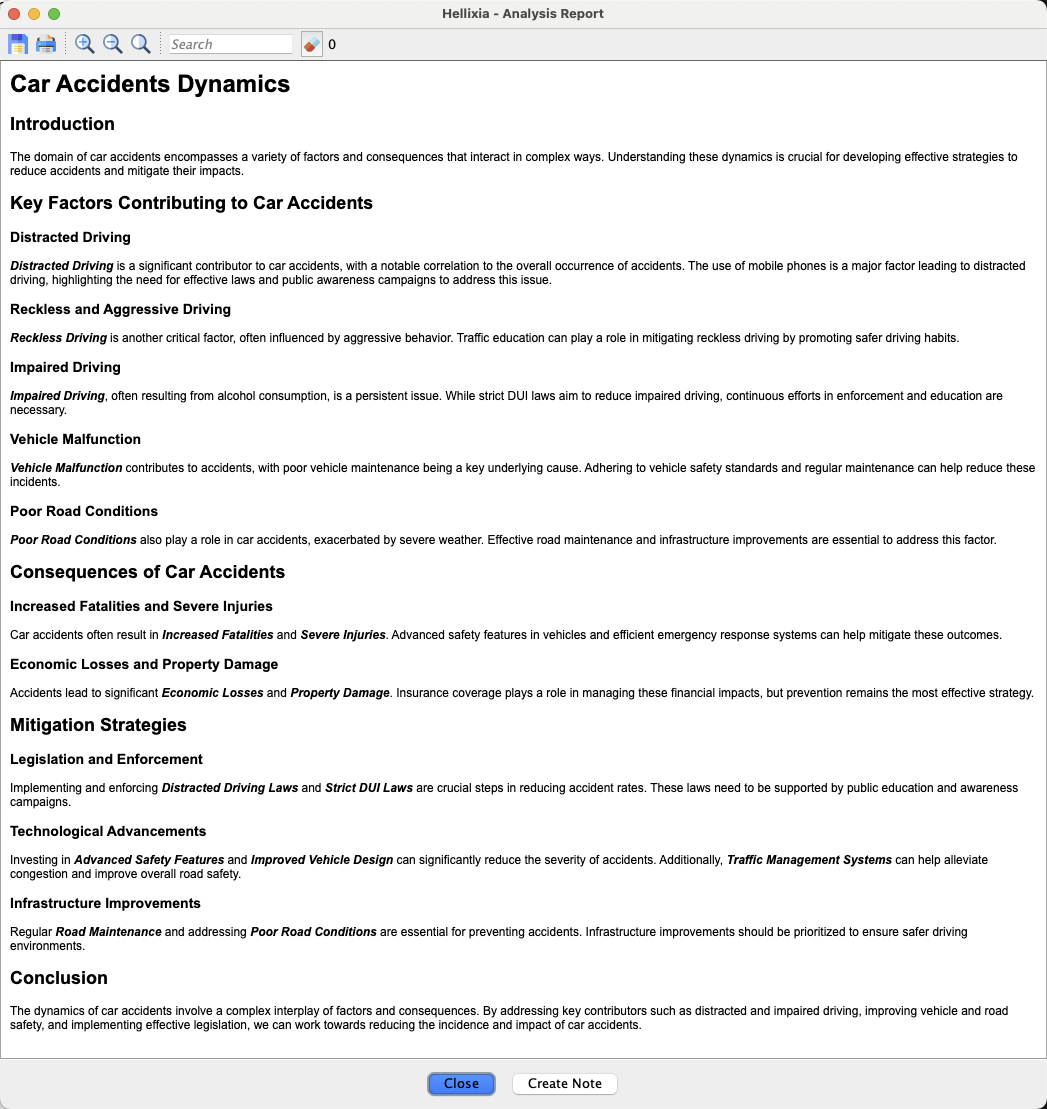
Generate the Relationship Analysis report (Analysis > Report > Relationship) to assess the strength of the relationships between the nodes.
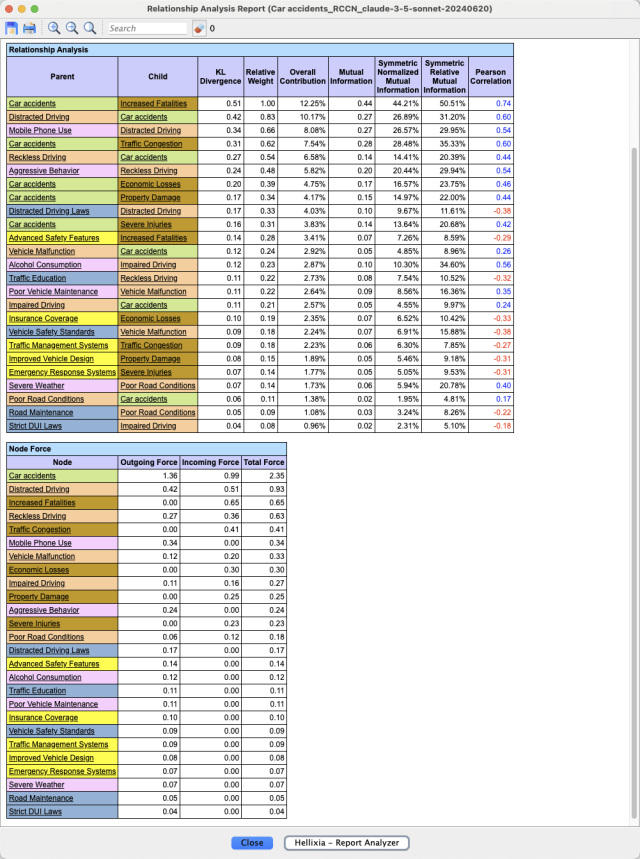
Use Hellixia to summarize the arc and node forces within this network.