Graph Windows
Context
A Graph Window is a container for network graphs, which represent qualitative and quantitative information regarding a domain:
- Qualitative refers to the structure of the network graph, i.e., nodes and arcs.
- Quantitative refers to the Conditional Probability Tables that define probabilistic relationships and any dataset that can be associated with the Graph Window.
Each Graph Window is a distinct entity and is associated with a corresponding file in BayesiaLab’s XBL format. The filename associated with each Graph Window is displayed in the upper-left corner of the Graph Window frame, and you can keep multiple Graph Windows open simultaneously and work on them in parallel. You can switch between Graph Windows and arrange them on your screen using the Graph Bar at the bottom of the Graph Window.
Illustration
Usage
A Graph Window can be in two modes:
as indicated by their corresponding buttons in the lower-left corner.
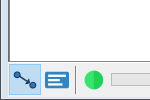
Modeling Mode F4
In Modeling Mode F4, you can conduct all modeling activities, such as learning and editing network graphs. In this mode, only the Graph Panel is visible and accessible inside the Graph Window, i.e., it fills the Graph Window entirely.
Validation Mode F5
In Validation Mode F5, both the Graph Panel and the Monitor Panel are visible. Model validation, analysis, and simulation are performed exclusively in this mode.
Switching Between Modeling Mode & Validation Mode
You can switch between Modeling Mode F4 and Validation Mode F5 by clicking on the respective buttons or using their keyboard shortcuts.
In any workflow with BayesiaLab, switching between these two modes is very frequent. Hence, we highly recommend that new users start using the F4 and F5 shortcuts straight away.