Contribution Analysis (5.0.7)
Context
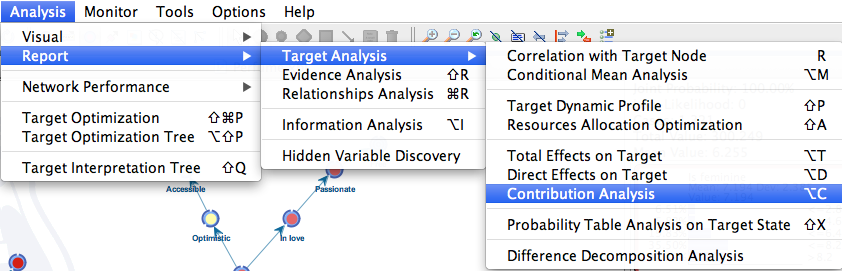
Validation Mode: Analysis | Report | Target Analysis | Contribution Analysis
New Function: Contribution Analysis
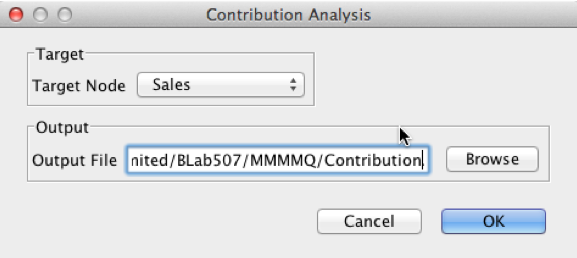
Contribution Analysis was designed to be used in the context of marketing mix analysis.
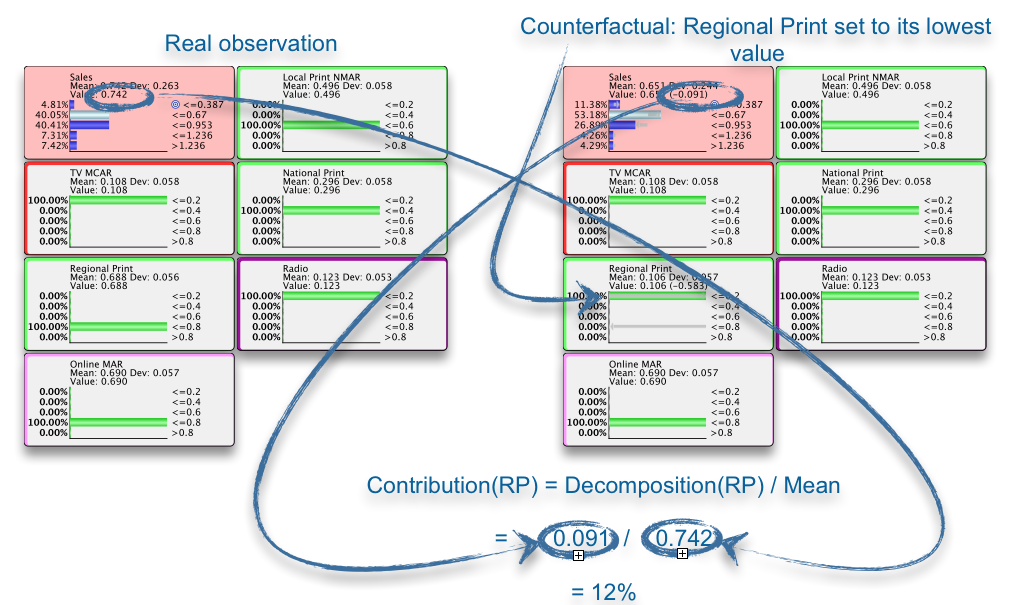
Contribution Analysis computes the contribution of each variable towards the predicted mean of the target variable for each observation, i.e. each line in the dataset. This contribution of the variables is computed using counterfactuals. The counterfactual is best expressed in the form of a question: what would have been the mean value of the target, had the variable been set to the lowest state, instead of the state in which it was actually observed? In a more practical context we might ask: Had the marketing budget been 100,000 we spent, what would have been the hypothetical revenue, instead of 100,000 we spent in marketing? What would we have missed in revenue, had we not spent the $100,000 for marketing?
Example
CSV File
The Decompositions and Contributions can be saved in a CSV file, providing these measures for every single observation, i.e. each line in the database. This can be used, for instance, to monitor Contributions over time.
Report
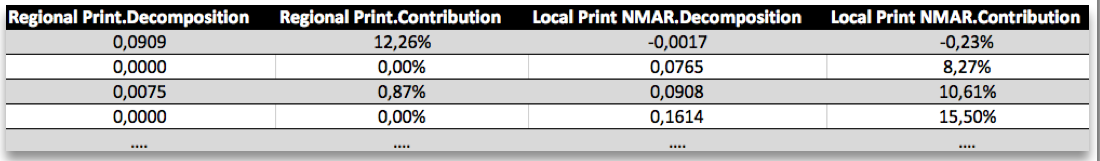
Upon concluding the Contribution Analysis, one additional report is generated. It returns the mean of the Decompositions for each variable computed over the entire dataset. Also, it shows the corresponding Contribution with respect to the Target Mean.
In addition, BayesiaLab computes Decompositions and Contributions on the basis of the network (model) only, with Likelihood Matching.
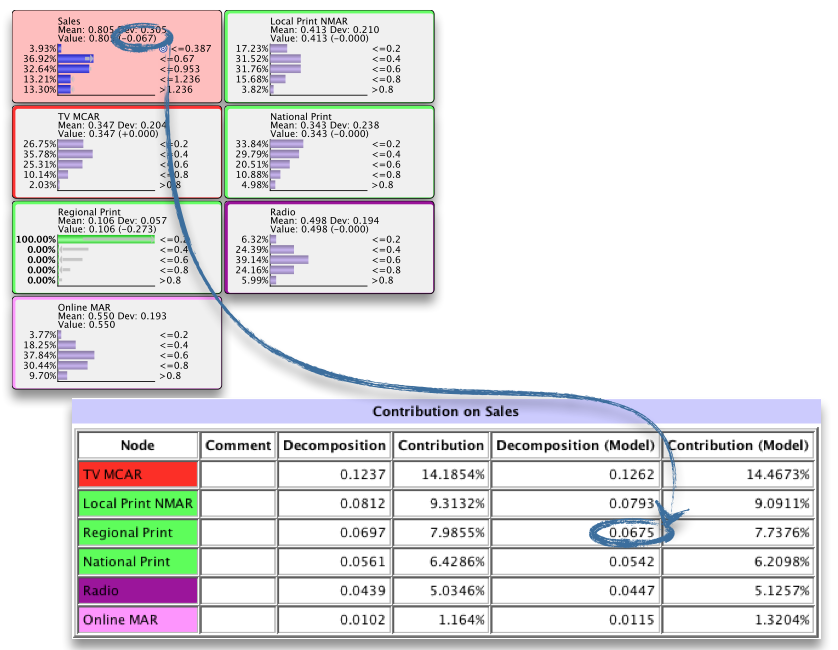
One would read this example report as follows: Had Regional Print not been what it actually was, but had it rather always been the lowest observed level, with all the other variables taking their actually observed levels, the target mean would have been lower by 0.0675. In other words, had it not been for Regional Print, Sales would have been lower by 7.7%.