Structural Coefficient
Background & Motivation
BayesiaLab utilizes proprietary score-based learning algorithms. As opposed to the constraint-based algorithms that use independence tests for adding or removing arcs between nodes, BayesiaLab employs the Minimum Description Length Score (MDL Score) to measure the quality of candidate networks with respect to the available data.
The Minimum Description Length Score (MDL Score) is derived from Information Theory and has been used extensively in the Artificial Intelligence community.
It consists of the sum of two components that estimate:
- the minimum number of bits required to represent a model, and
- the minimum number of bits required to represent the data given the model.
However, in the specific context of Bayesian networks, we need to explain the exact meaning and the notation of these two components:
- “the minimum number of bits required to represent a model” is denoted DL(B) (=“Description Length of the Bayesian network B”) and refers to the structural complexity of the Bayesian network model B, which includes the network graph and all probability tables.
- For brevity, we often use the shorthand “complexity” or “structure” to refer to DL(B).
- Small values of DL(B) suggest a simple model structure, large values a complex model.
- The goal of this structural part is to apply Occam’s Razor, or the law of parsimony, i.e., to choose the simplest hypothesis all other things being equal.
- “the minimum number of bits required to represent the data given the model” is denoted DL(D|B) (=“Description Length of the data D given the Bayesian network B”) and refers to the likelihood of the data D with respect to the Bayesian network model B.
- The data likelihood is inversely proportional to the probability of the observed dataset as inferred by the Bayesian network model.
- Put simply, DL(D|B) refers to the “fit” of the model to the data.
- Small values of DL(D|B) suggest a well-fitting model; large values, conversely, imply a poor fit.
BayesiaLab attempts to minimize the MDL Score as it evaluates candidate networks during structural learning.
Learn More About Calculating Complexity and Fit
Note that the extreme case of α=0 can lead to a fully-connected network, as the structural complexity is entirely discounted.
Alternative Interpretation
There is another way to interpret the Structural Coefficient (α), which can help in understanding its role in learning a Bayesian network.
Weighting (DL(B)) with a factor (α) is equivalent to changing the original number of observations (N) in a dataset to a new number of observations (N’):
An (α) value of 0 would be the same as having an infinite number of observations (N’). As a result, the MDL Score would only be based on the fit component of the score, i.e., (DL(D \mid B)), and BayesiaLab’s structural learning algorithms would produce a fully-connected network.
At the other extreme, an (α) value of 150 would massively favor the simplest possible network structures as the new equivalent number of observations (N’) would only be 1/150th of (N).
It is perhaps more intuitive to consider the new number of observations (N’) as weighted counts of the actual observations (N). For instance, (α = 0.5) is equivalent to counting all observations twice.
Practical Relevance
From a practical perspective, the Structural Coefficient (α) can be considered a kind of “significance” threshold for structural learning.
- The higher you set the (α) value, the higher the threshold for discovering probabilistic relationships. Conversely, the lower you set the (α) value, the lower the discovery threshold, and weaker probabilistic relationships would still be found and represented by an arc.
- Reducing (α) can be helpful if you have a small dataset from which you want to learn a model. Perhaps at the default value, (α = 1), the learning algorithm would not find any arcs.
- However, choosing too low a value might result in “overfitting,” i.e., learning “insignificant” relationships or discovering patterns in what turns out to be mere noise.
- BayesiaLab can help reduce the risk of overfitting with the Structural Coefficient Analysis/cross-validation-structural-coefficient-analysis-(5.0.2)) feature.
Usage
There are multiple ways to open the Structural Coefficient window:
- From the Main Menu, select
Edit > Edit Structural Coefficient. - Click on the background of the Graph Panel, then, from the Context Menu, select
Edit Structural Coefficient. - If the Structural Coefficient indicator is displayed in the Status Bar, click on the icon.
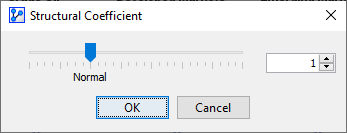
In the open Structural Coefficient window:
- Use the slider to select the desired level.
- Use the up/down buttons to change the display value in 0.05-increments.
- Type in the desired value.
Example & Workflow Animation
To illustrate the usage of the Structural Coefficient and its impact on learning, we utilize an example presented in the webinar, Analyzing Capital Flows of Exchange-Traded Funds.