Normalized Entropy
Definition
Normalized Entropy is a metric that takes into account the maximum possible value of Entropy and returns a normalized measure of the uncertainty associated with the variable:
Example
In this new example, we now compare the variables and , which each represent ball colors:
Normalized Entropy allows us to compare the degree of uncertainty even though these two variables have different numbers of states, i.e., two versus eight states:
Usage
In BayesiaLab, the values of Entropy and Normalized Entropy can be accessed in a number of ways:
In Validation Mode , with the Information Mode activated, hovering over a Monitor with your cursor will bring up a Tooltip that includes Entropy and Normalized Entropy.
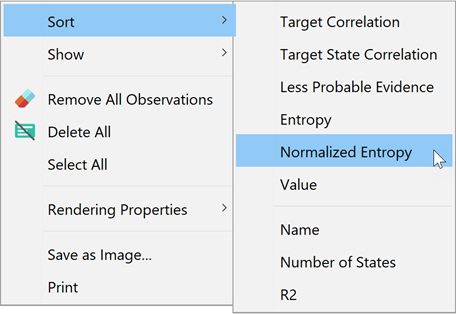
You can also sort the Monitors in the Monitor Panel according to their Normalized Entropy via Context Menu > Sort > Normalized Entropy.

The Normalized Entropy is also available as a Node Analysis metric for Size and Color in the 2D and 3D Mapping Tools.
In Function Nodes, Entropy and Normalized Entropy are available as Inference Functions in the Equation tab.
- Entropy:
Entropy(?X1?, False) - Normalized Entropy:
Entropy(?X1?, True)
