2D Mapping (9.0)
Context
Analysis | Visual | Overall | Mapping | 2D Mapping
Analysis | Visual | Overall | Node Force |
Analysis | Visual | Target | Contributions | Interactive |
Learning | Clustering | Variable Clustering |
History
2D Mapping was first introduced in version 5.1 (opens in a new tab) and then updated in version 5.3 (opens in a new tab), 5.4 (opens in a new tab), 7.0 (opens in a new tab), and 8.0 (opens in a new tab).
In addition to the 2D Mapping Tool, local 2D mappings are also available by clicking in Node Force (opens in a new tab), Interactive Contributions Analysis (opens in a new tab), and Variable Clustering (opens in a new tab) toolbar.
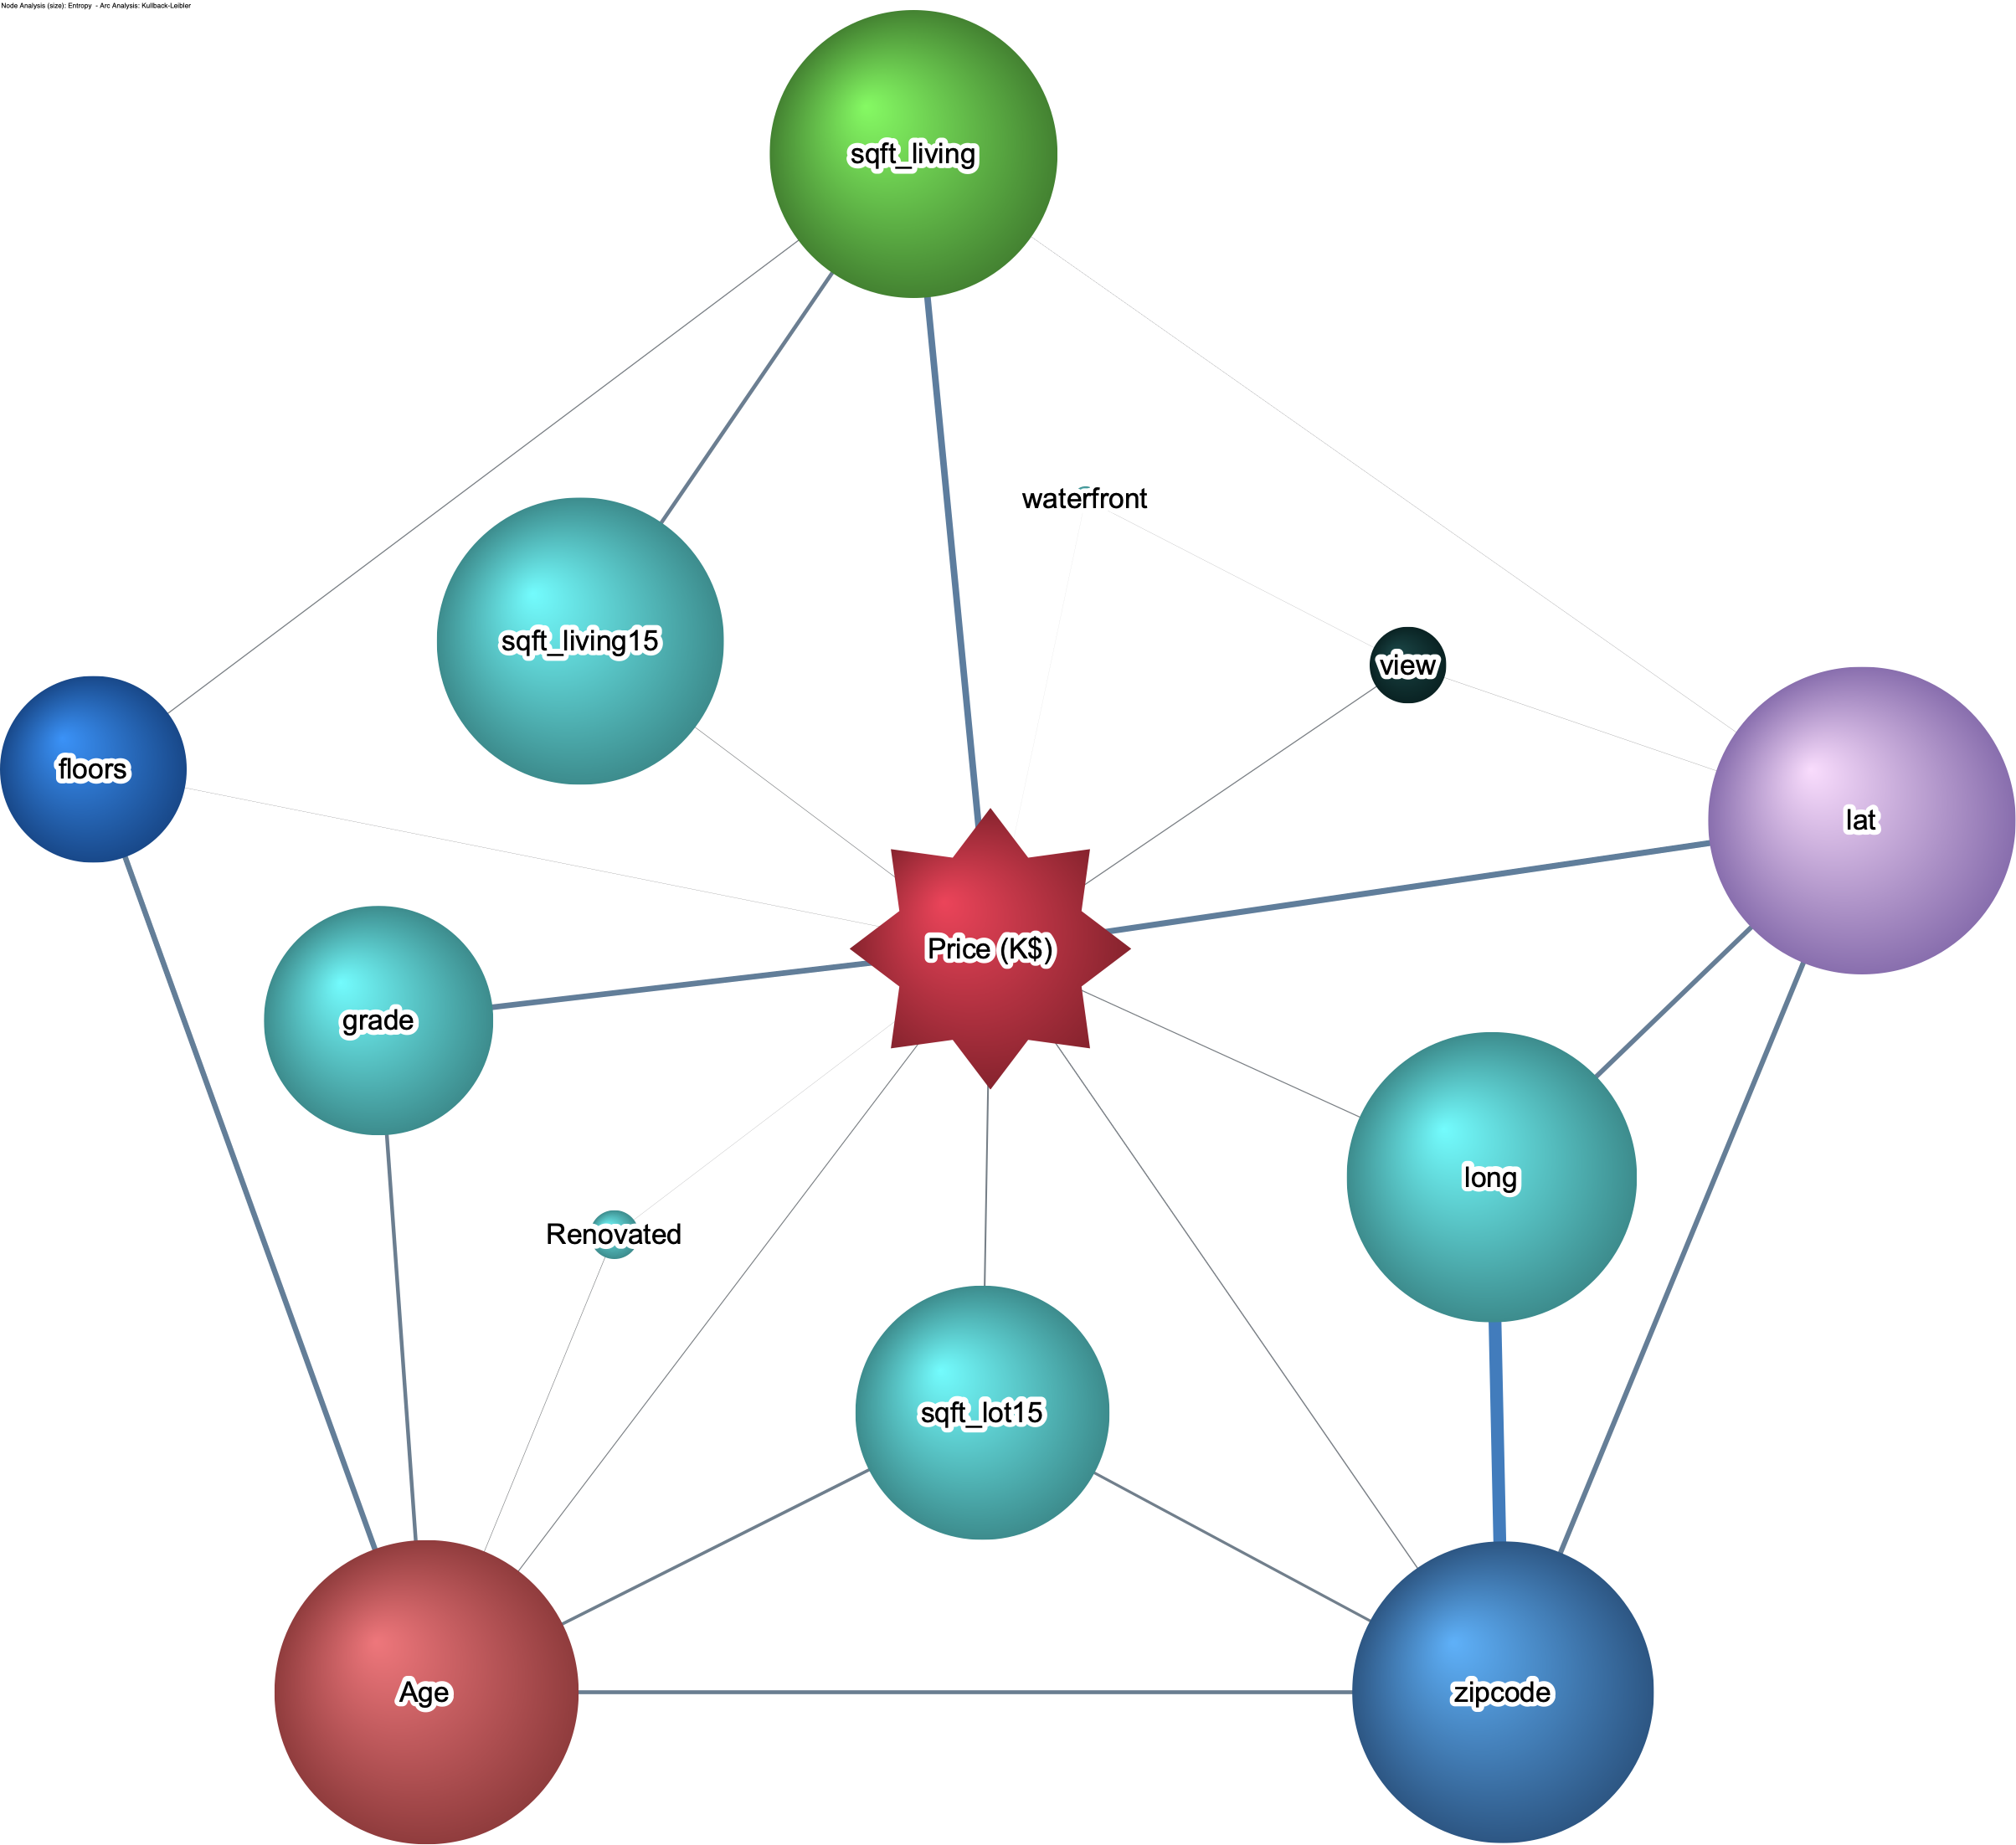
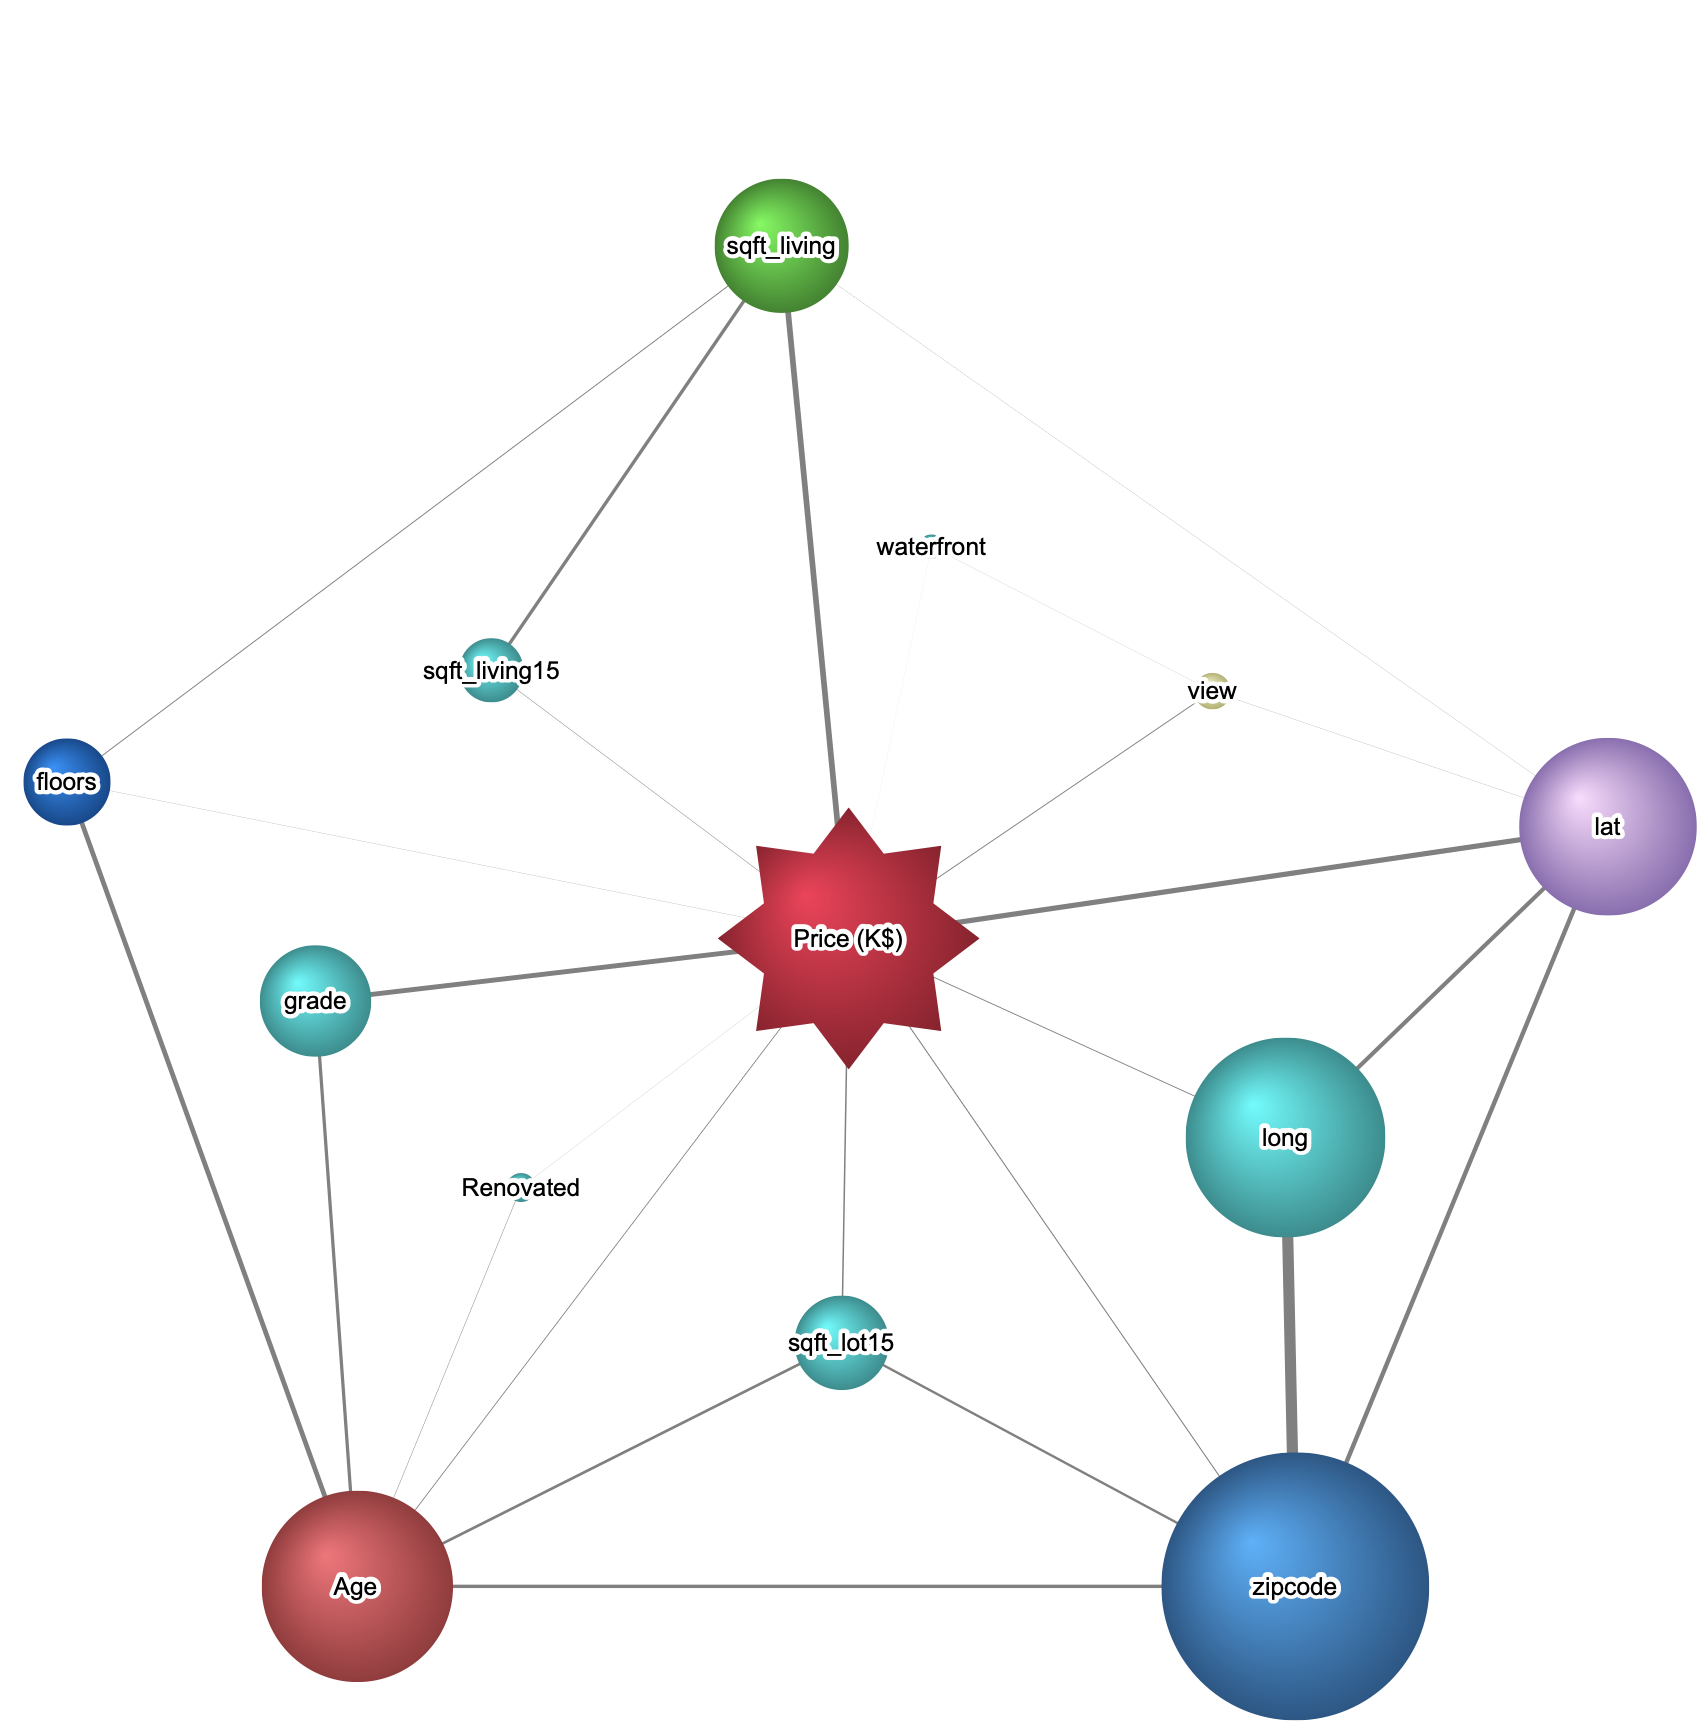
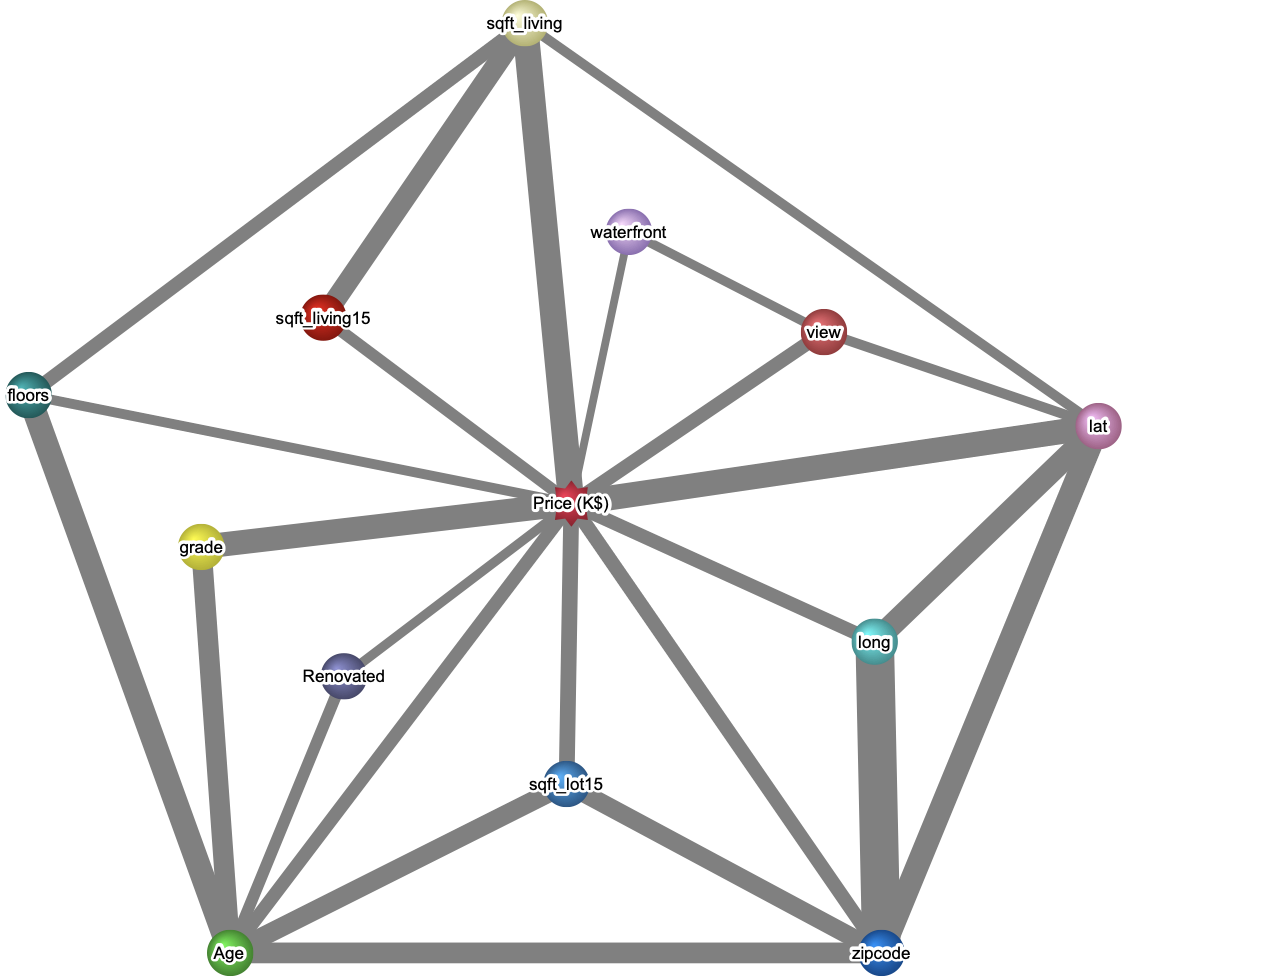
New Feature: Representation of the Target Node
The Target node is now represented by a star in order to quickly identify it among the set of nodes.
Example
New Feature: Non-Redundancy of the Metrics
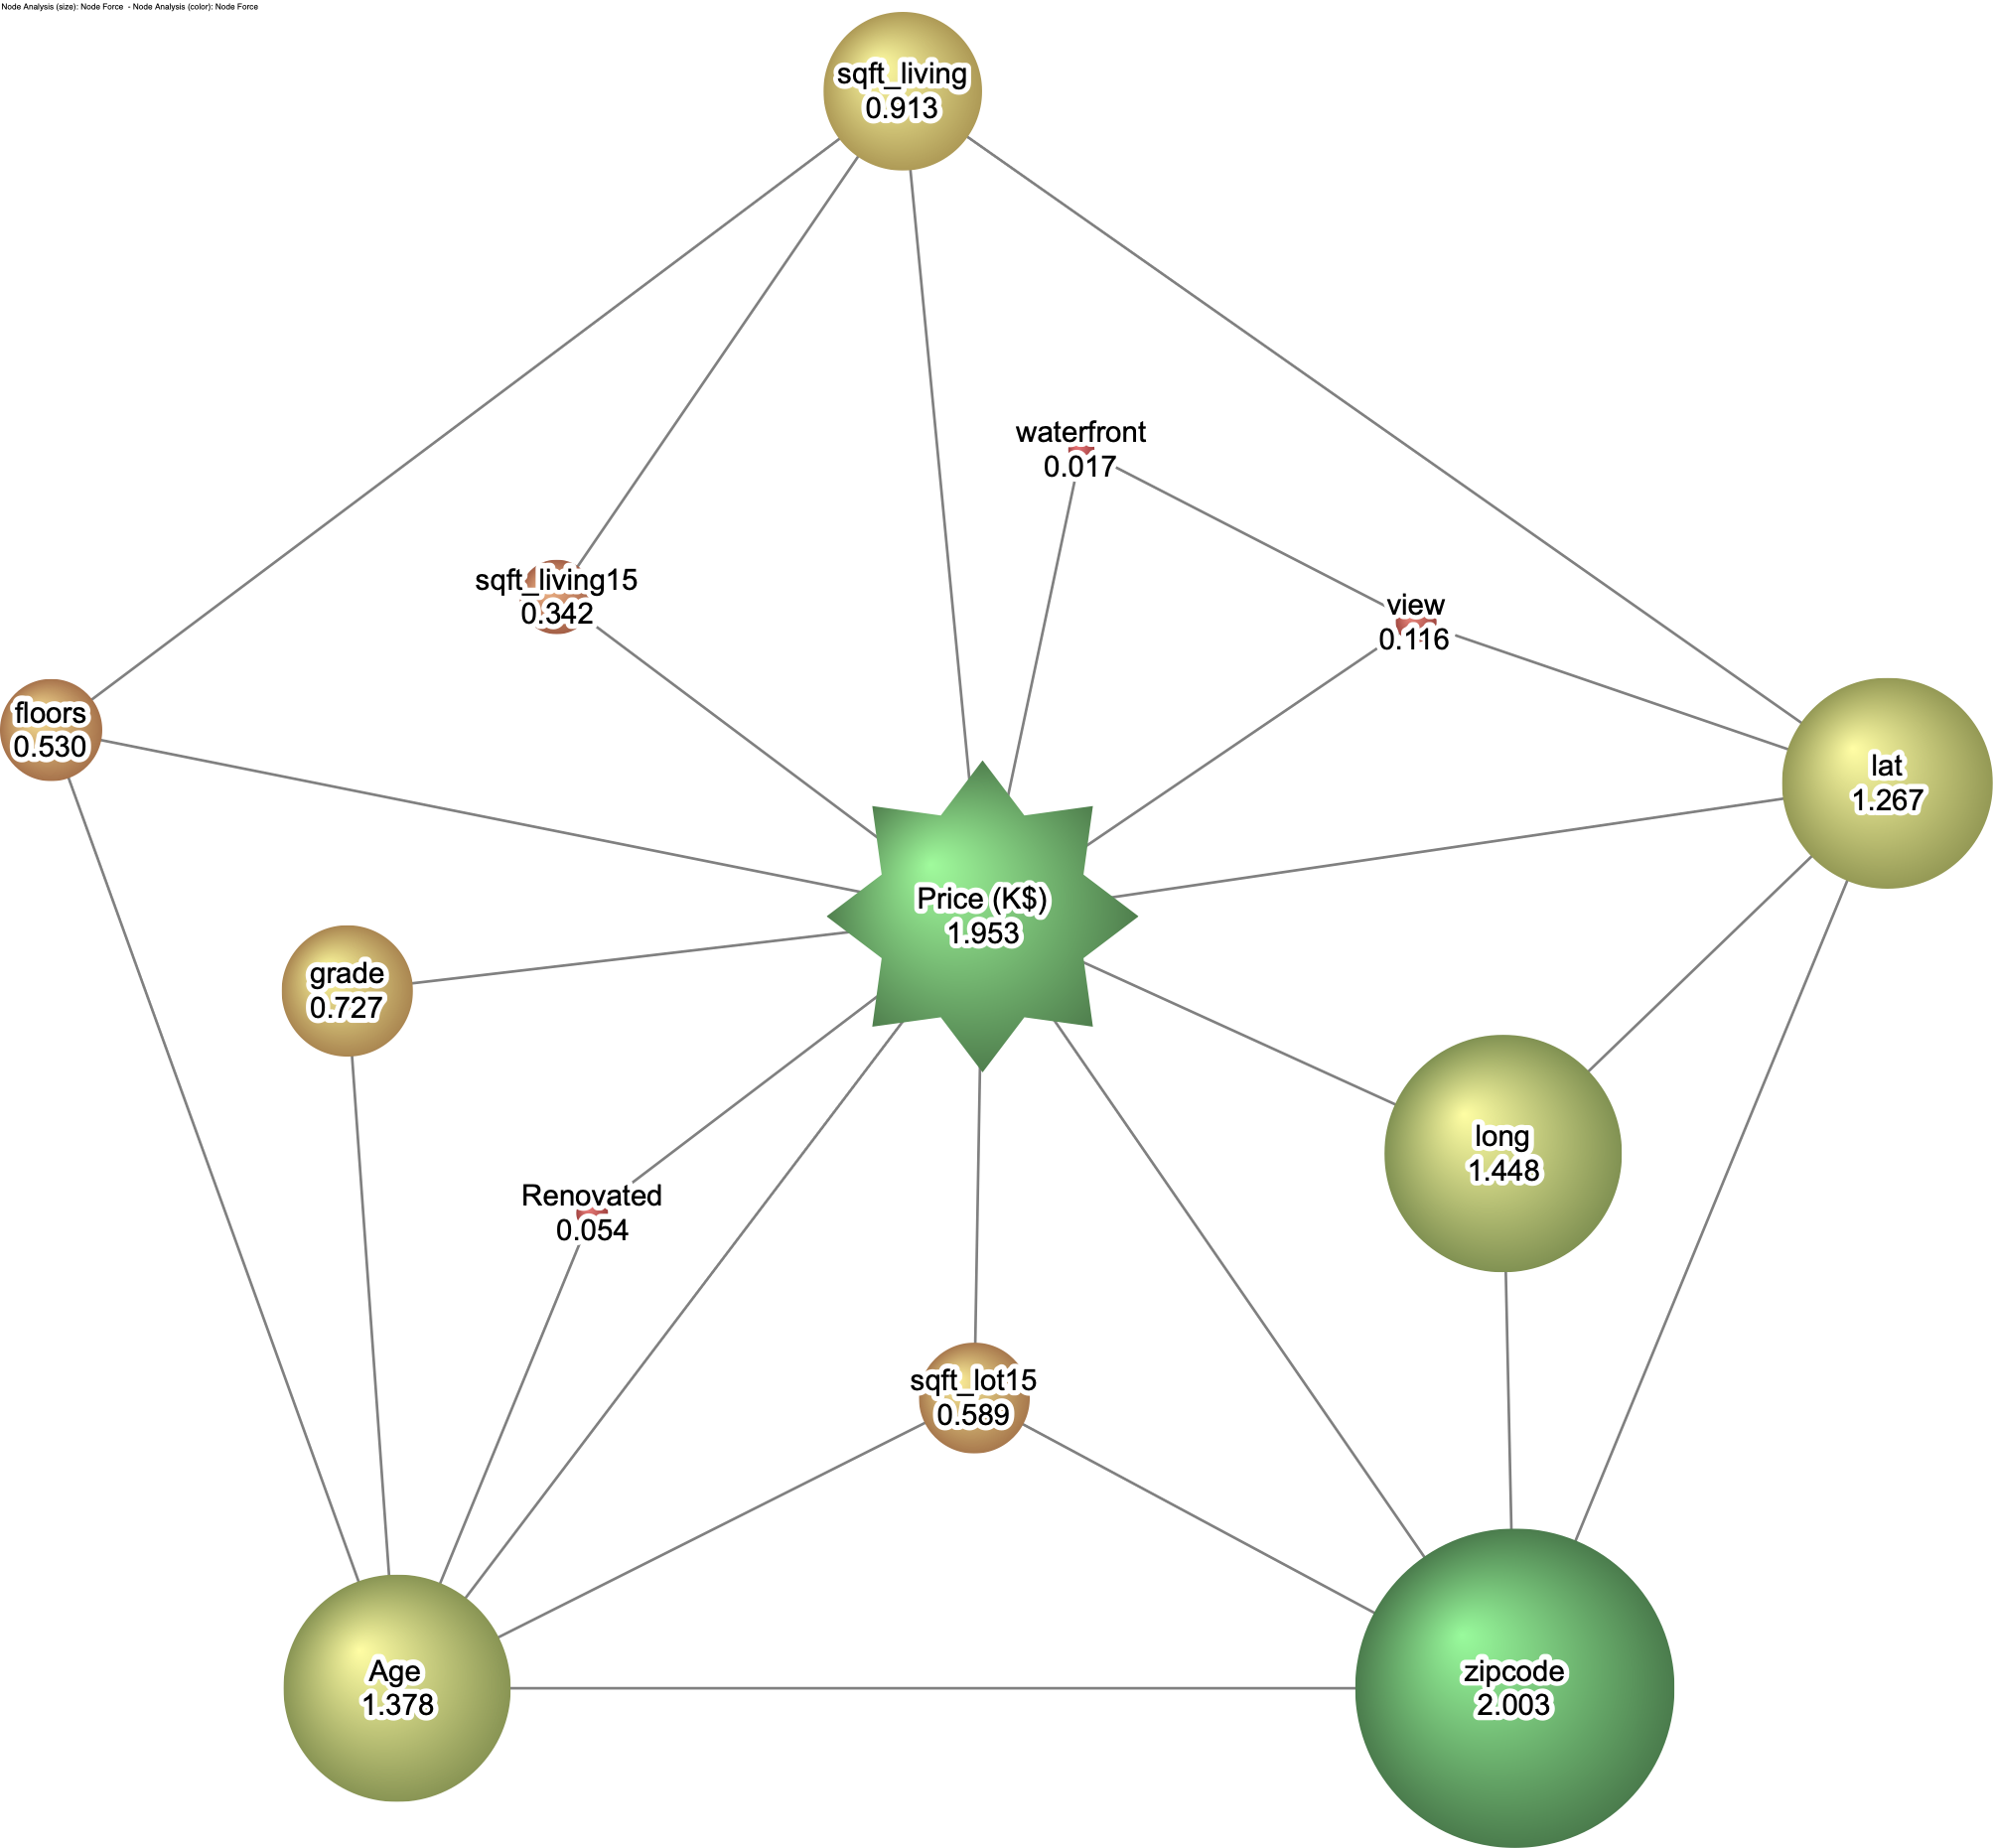
In 2D and 3D Mapping, when the same metric is used for the node size and color, the score is no longer duplicated in the label.
Example
The 2D Mapping below uses Node Force for the size and color of the nodes.