Continuous Nodes
Context
In BayesiaLab, the Continuous Node type implies that each numerical value of the underlying variable is assigned to one of several intervals (or bins), i.e., the variable is represented in a discretized form in the Continuous node. All of the Continuous node’s intervals cover the entire range of values (or domain) of the underlying variable. On the Graph Panel, a Continuous Node appears as a solid blue disc with a dashed outline . The “breaks” in the outline symbolize the fact that Continuous nodes are always discretized, i.e., “broken” into bins.
Usage
Compared to Discrete Nodes, the Node Editor for Continuous Nodes shows several different options. The different treatment is due to the fact that each state in a Continuous Node represents intervals of values, so many of the functions are related to viewing and editing those intervals.
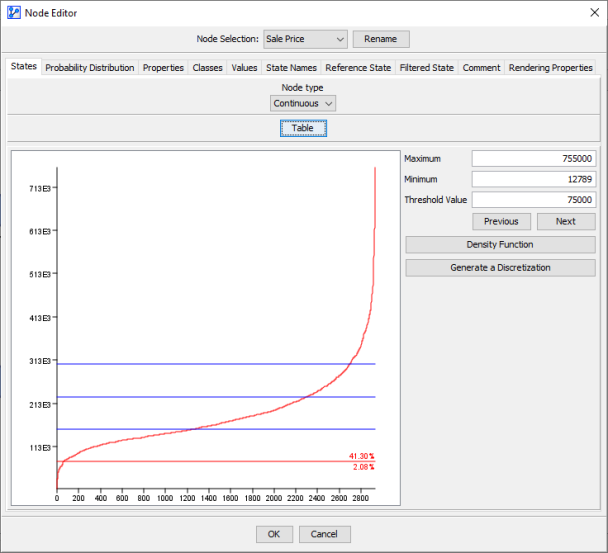
Within the States tab, there are two main views for editing the intervals of a Continuous Node:
- Table View, available for nodes with and without associated data.

- Curve View, only available for nodes with associated data.