Occurrences Report
Context, Background, and Motivation
Occurrences refer to the number of observations in a cell of a Probability Table or a Conditional Probability Table.
The number of cells in a Conditional Probability Table is a function of the following parameters:
- The number of Parent Nodes.
- The number of Node States of the Parent Nodes.
- The number of Node States of the Child Nodes.
The following example with one Parent Node (Age, measured in years) and one Child Node (BMI, i.e., Body Mass Index, measured in kg/m2) illustrates this with numbers:
Here, Age is discretized into 4 states and BMI into 6 for a total of 48 cells in the table associated with BMI. The numbers in each cell are counts of observations or Occurrences. In our case here, each Occurrence represents one person from the sample of 200 individuals. For instance, the Occurrence table associated with BMI states that Count(BMI≤20 | Age≤30)=2. So, we have only two Occurrences of that particular condition, i.e., only two individuals who are 30 years old or younger have a BMI of 20 or lower.
To create a Bayesian network, BayesiaLab needs to translate the Occurrences in each cell into probabilities. However, with a small number of Occurrences, that can become an issue. We have repeatedly referenced a rule of thumb, which says that we should have a minimum of 5 Occurrences per cell to estimate a Probability Table or Conditional Probability Table reliably. In our example, we have several cells that fall below the recommended minimum. In a small example, such deficiencies are easy to recognize, but in more complex networks, it can be difficult to spot such weaknesses.
That is the motivation for the Occurrences Report. It displays all tables in a network and visually highlights potentially problematic cells in which Occurrences are low.
Usage
Select the nodes you want to include in the Occurrences Report. If none are selected, the analysis will be performed on all nodes. To create the Occurrences Report, select Menus > Network > Reports > Occurrences. The Occurrences Report opens and shows all Probability Tables and Conditional Probability Tables.
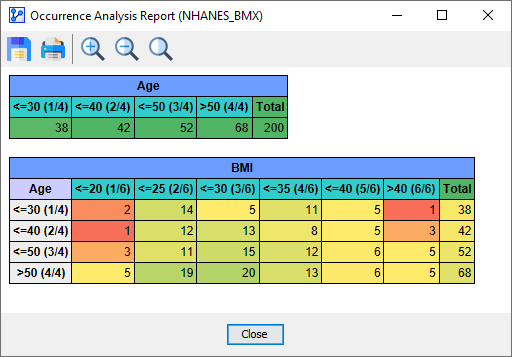
The fields in the report are color-coded to highlight potential issues:
- Cells with 0 Occurrences are marked in red.
- Cells with 5 Occurrences are marked in yellow. This is generally considered the minimum number of Occurrences.
- Cells with 40 or more Occurrences are marked in green.
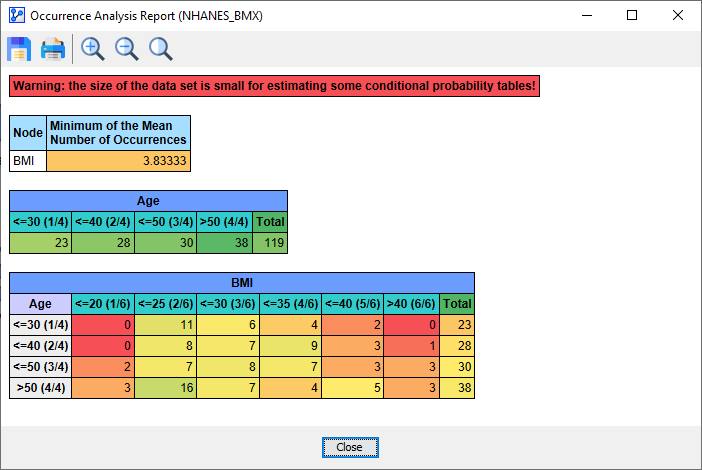
Furthermore, the Occurrences Report calculates the mean number of Occurrences for each row in all Probability Tables and Conditional Probability Tables. If the mean value of any row in any of the nodes drops below the threshold of 5, the corresponding nodes are called out at the top of the report. Additionally, the affected nodes in the Graph Panel are marked with the information icon.
If the mean value of any row in any of the nodes drops below the threshold of 4, an additional warning message appears at the top of the report.
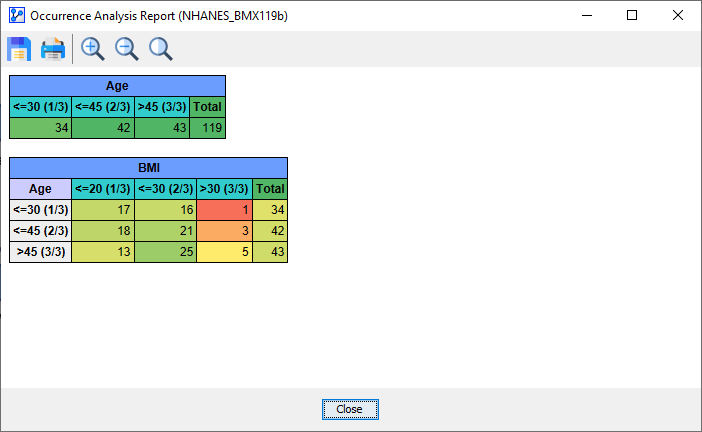
At this point, at the latest, you should review the Discretization (for Continuous variables) and Aggregation (for Discrete variables). After arbitrarily reducing the number of states to three for both nodes (just for demonstration purposes), we see that the Occurrences Report now seems much less problematic.