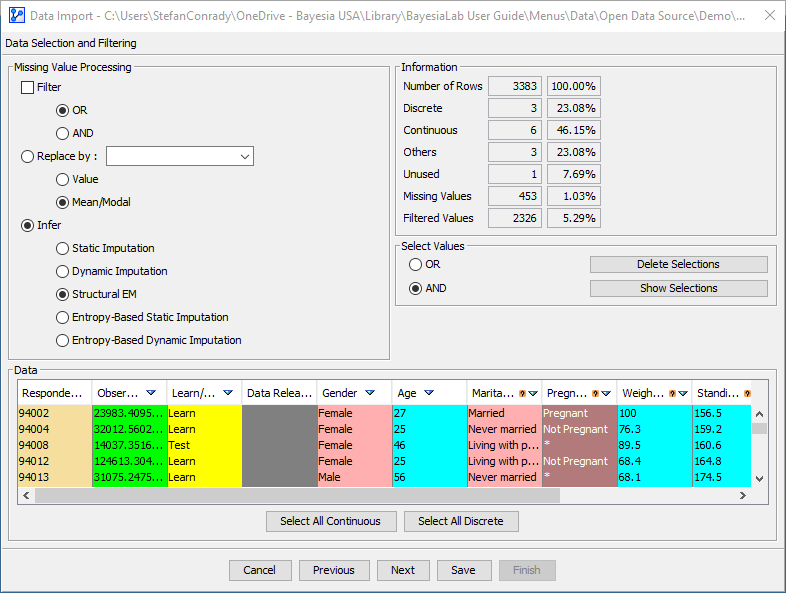
Step 3 — Data Selection, Filtering, and Missing Value Processing
Context
- Step 3 of the five-step Data Import Wizard deals with Data Selection, Filtering, and Missing Value Processing.
Overview of Elements
- Missing Values Processing
- Information (same as in Step 2 — Definition of Variable Types)
- Select Values
- Data
Data
We start with the Data panel (even though it is at the bottom of the window) because it can help inform decisions about Missing Values Processing.
This Data panel resembles the Data panel in Step 2 — Definition of Variable Types.
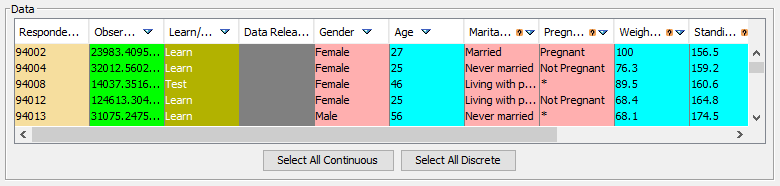
However, there are several important additional pieces of information available:
- A Missing Values icon indicates the presence of at least one Missing Value in the corresponding variable.
- A triangle icon indicates that variable-specific statistics are available. It appears on all variable headers with the exception of variables of the type Row Identifier and Learn/Test.
- Clicking on the triangle icon or the associated variable header brings up a table with variable statistics.
- For Discrete variables, it shows the frequencies of all states, including Missing Values and Filtered Values:
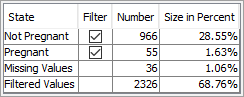
- The Filter checkboxes allow you to deselect specific values.
- The checked box means that the value is included, which is the default condition.
- The unchecked box means that the value is excluded and that all rows that contain that value will be filtered, i.e., removed.
- As you experiment with checking and unchecking, you can see how the Number of Rows in the Information panel changes.
In terms of a data query, the Filter checkbox would be the equivalent of a nominal-value row filter.
Note that the number of Filtered Values does not refer to the number of excluded rows due to an unchecked Filter checkbox.
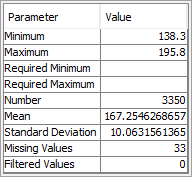
- For Continuous variables, it shows the standard statistics, such as Minimum, Maximum, Mean, and Standard Deviation. Additionally, the table displays the frequencies of non-missing values, Missing Values, and Filtered Values:
Select Values
-
The Select Values panel relates to the Filter checkboxes plus any Required Minima and Maxima applied in the Data panel.
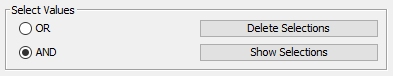
Three actions are available in this panel:
-
You can choose the logic for combining the Filters and Minima/Maxima assigned in the Data panel:
- OR: a row will be removed if ANY of the selected Filters or specified Minima/Maxima across all variables apply to that row.
- AND: a row will only be removed if ALL of the selected Filters and specified Minima/Maxima across all variables apply to that row.
-
Click the
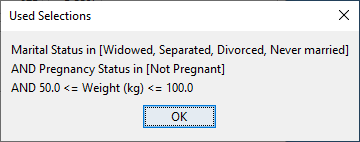
Show Selectionsbutton to review what Filters and Minima/Maxima are currently in place. -
Note the syntax for Discrete variables: The variable name is followed by “in” (i.e., is an element of) followed by the included values shown as an array in square brackets.
-
Further logical expressions are shown as conjunctions (AND) or disjunctions (OR) in separate lines.
-
Clicking the
Delete Selectionsbutton removes all Filters and Minima/Maxima currently in place.
Missing Values Processing
-
In the Missing Values Processing panel, you can specify which kind of processing to apply to variables with Missing Values, i.e., Filter, Replace, and Infer.
-
This panel is only active if you select one of the variables that features a small question mark icon . This icon indicates that the corresponding variable contains at least one Missing Value.
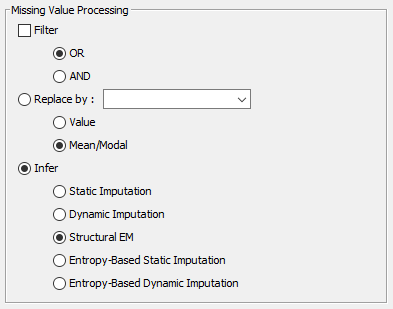
Filter
-
The Filter function allows you to remove rows from the dataset that contain Missing Values. This is equivalent to what is commonly known as casewise deletion.
-
You can apply the Filter individually to any variable that contains Missing Values.
Despite the similarity in name, this function is not related to [Filtered Values].
Usage
- In the Data panel, click on the header or into the column of the variable with Missing Values.
- Then, check the
Filtercheckbox in the Missing Values Processing panel. - Next, choose the logical condition to apply when you select multiple variables to be subject to the Filter.
OR: a row will be removed if ANY of the selected variables contain a Missing Value in that row.AND: a row will only be removed if ALL of the selected variables contain a Missing Value in that row.
Before applying the Filter, please consider the implications discussed in the section Filter Listwise/Casewise Deletion.
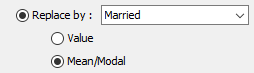
Replace By
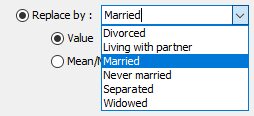
With the Replace By function, you can specify a value for replacing the Missing Values in the selected variable.
You have several options in this regard:
-
You can set a specific value:
-
For a Discrete variable, you can select among the values observed in the variable from a dropdown list.
-
Alternatively, you can choose the Modal value, i.e., the most frequently occurring value of the variable in the dataset.
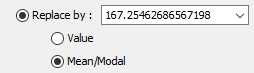
-
For a Continuous variable, you can select to use the Mean value computed from the dataset.
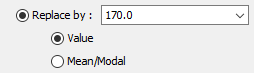
-
As an alternative, you can specify any arbitrary value.
-
Infer
- For practical analysis purposes, the Infer option is the most common method for Missing Values Processing.
- To learn about Missing Values Processing beyond Filter and Replace By, please see Missing Values Processing in Chapter 9 of our e-book.
The Methods in Detail:
- Infer — Static Imputation
- Infer — Dynamic Imputation
- Infer — Structural EM
- Infer — Entropy-Based Imputations
Information
- The Information panel is identical in its functionality to the Information panel in Step 2 — Definition of Variable Types. Please refer to that topic for details.