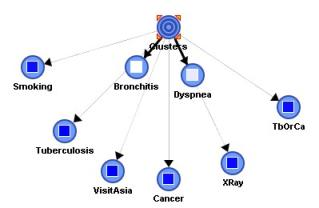
BayesiaLabBayesiaLab User GuideAnalysisVisual AnalysisTarget AnalysisMutual InformationPictogramsCorrelations with the Target NodeCorrelations with the Target Node Context This visualization shows how much information each node contributes with regard to the Target Node. The brightness of the squares inside each node is proportional to this contribution. PictogramsCorrelations with a State of the Target Node