Network Performance Analysis: Target — ROC
When one is faced with the problem of predicting the value of a particular variable, the evaluation of the Bayesian network can be performed using a ROC Curve (Receiver Operating Characteristic).
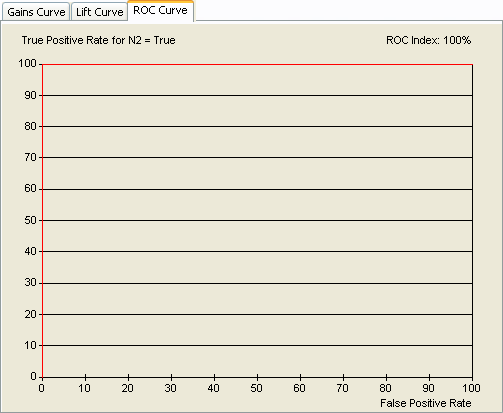
This graph is a plot of the True Positive Rate (Y-axis) against the False Positive Rate (X-axis). A point on the curve corresponds to the result obtained by using a particular threshold (a probability value) for the decision rule, i.e., to decide whether the case has the target value based on the threshold and its probability of having the target value: .
The following figure depicts the ROC curve corresponding to an optimal model. In fact, the optimal curve indicates that all the cases with the target value have a probability greater than those without this target value.
A left-click on the graphical zone of the curve allows obtaining the exact coordinates of the corresponding point and the value of the corresponding threshold.
For example, the screenshot below indicates that a threshold of 53.13% implies a detection rate of 79.89% with 1.59% of false positive examples.

The ROC index is computed according to the curve and displayed at the top of the graphic. It represents the surface under the ROC curve divided by half of the total surface. The diagonal corresponds to the performance of a model with a ROC index equal to 0%, i.e., a useless model.
A right-click on the graphical zone allows choosing between printing the curve and copying the curve to the clipboard. In the latter case, it is possible to paste the curve directly as an image, or to paste the data points corresponding to the curve.