Sensitivity Analysis
Context
-
All inference in BayesiaLab is performed on the basis of the Bayesian network.
-
Regardless of whether you set one piece of evidence to predict a Target Node, or whether BayesiaLab performs thousands of simulations in the context of Target Optimization, all such inference is always performed on the network model — and never on the underlying data, if the network was learned from a dataset.
-
As a result, the quality of the analysis hinges on the quality of the Bayesian network.
-
BayesiaLab offers a wide range of tools for testing and validating networks to help find the most appropriate network structure for the given objective in the context of machine learning.
-
However, even with a theoretically optimal network structure representing the true data-generating process of the domain, uncertainties will inevitably remain with regard to the parameters, i.e., the percentages recorded in the Probability Tables and Conditional Probability Tables.
- If the network is based on the knowledge of experts, the uncertainties derive from potentially diverging judgments, and thus parameter estimates have a distribution.
- If the network is learned from data, the dataset is typically a finite sample from a population, and thus parameter estimates have a distribution. Needless to say, larger sample sizes provide for “narrower” parameter estimates.
-
The percentages in the Probability Tables and Conditional Probability Tables, however, are fixed once they are estimated, and any uncertainty regarding the parameters is no longer visible.
-
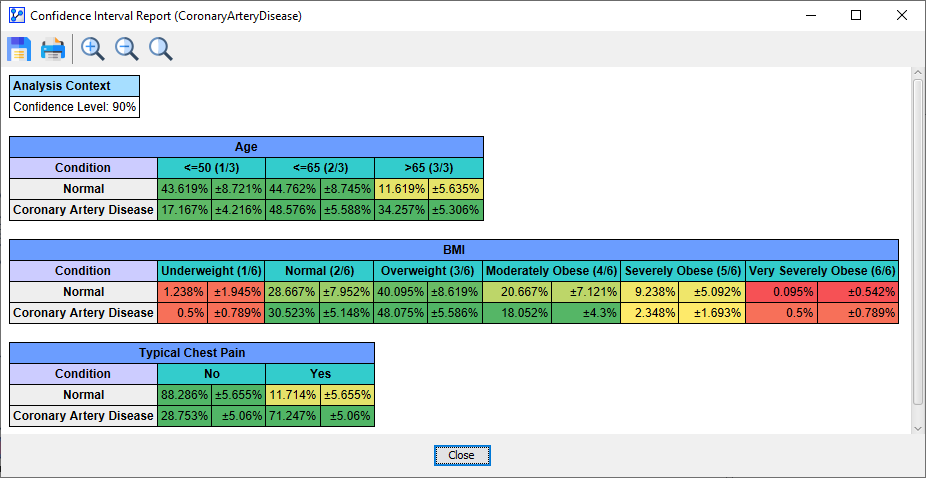
The Sensitivity Analysis functions in BayesiaLab address this concern by utilizing the computed Confidence Intervals of all parameter estimates of all nodes, which are shown in the following excerpt from a Confidence Interval Report.
-
Please see Confidence Interval Report for more details on how BayesiaLab calculates the Confidence Intervals.
-
For instance, the above report shows Additionally, we see that the Confidence Interval of that probability is 5.655%.