Relationship with the Target Node
Context
- The Correlation with Target Node report is available for any target node.
Usage
- You can run this report either from the Analysis menu or by using the shortcut
R. - This report, which can be saved in HTML format, has several sections:
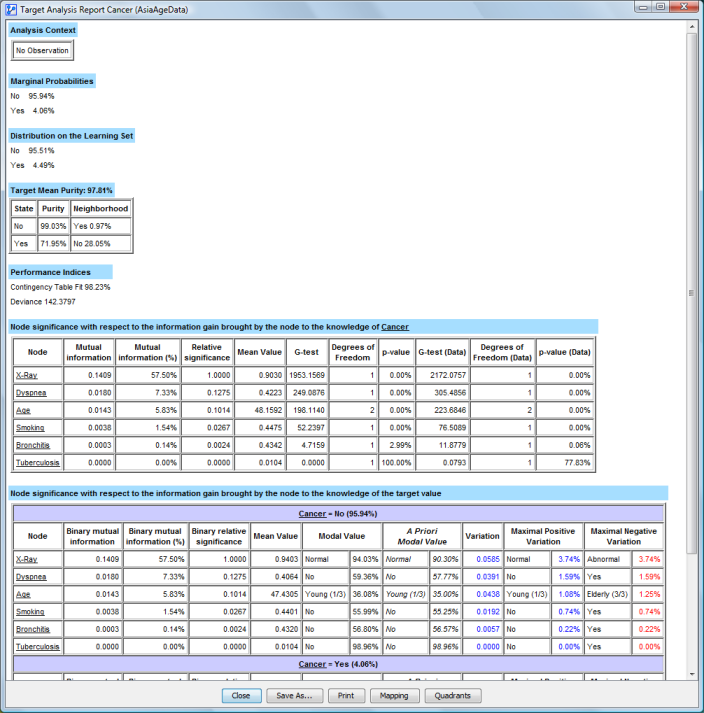
Analysis Context
- This section lists any variable observations that apply while the analysis is performed.
Marginal Probability Distribution
- This section lists the probability distribution of the Target Node, given the observed variables listed in the Analysis Context.
Distribution on the Learning Set
- If a database is associated with the network, the Target Node’s probability distribution is computed directly from the database.
Target Mean Purity
- The Target Node’s Mean Purity is computed if a database is associated with the network. For each record in the database, we check whether the network correctly predicts the actual Target State.
The table underneath shows, state-by-state, the results of the predictions. The column Neighborhood indicates for which state the network prediction was wrong, along with the corresponding percentage.
Performance Indices
-
If a database is associated, two performance indices are computed for the network:
-
The Contingency Table Fit represents the degree of fit between the network’s joint probability distribution and the associated data. The better the network represents the database, the higher the value of the Contingency Table Fit. This measure, computed from the database’s mean log-likelihood, is equal to 100% if the joint is completely represented (as in a fully connected network), or 0% if the joint is represented by a fully disconnected network. The dimensions represented by any not-observable nodes are excluded from the computation.
-
The Deviance measure is computed from the difference between the network’s mean log-likelihood and the database’s mean log-likelihood. The closer the value is to 0, the closer the network is to the database.
Node Significance with Respect to the Information Gain Brought by the Node to the Knowledge of the Target Node
-
This shows a list of nodes, sorted in descending order according to the information they bring to the knowledge of the Target Node. The nodes that do not provide any information do not appear in this list. This corresponds to the Target Node Analysis.
-
Mutual Information is the amount of information brought by each variable to the Target Node.
-
Mutual Information (%) is the amount of information brought by each variable to the Target Node, as compared to an unconnected network.
-
Relative Significance: ratio between the Mutual Information brought by each variable and the maximum Mutual Information, i.e., the value shown at the top of the list.
-
The Mean Value column displays the nodes’ mean values. Each node’s mean is computed as follows:
- If the node has values associated with its states, the mean is computed from them.
- If the node is continuous, its mean is computed from the intervals.
- If the node is discrete with integer or real-valued states, the mean is computed from them.
- Otherwise, a default set of values from 0 to the number of states minus one is used.
-
Chi2-test or G-test:
- Independence tests, Chi2 or G-test, are computed from the network for each variable and the Target Node.
- It is possible to change the type of independence test in the Statistical Tools settings in
Main Menu > Window > Preferences > Tools > Statistical Tools. - Degrees of Freedom indicates the degree of freedom between each variable and the Target Node in the network.
- p-value: represents the independence probability between each variable and the Target Node in the network.
- Chi2 or G-test (Data): The independence tests, Chi2 or G-test, are computed as above, but from the associated database, if applicable.
- Degrees of Freedom (Data): The degree of freedom is computed as above, but from the associated database, if applicable.
- p-value (Data): The independence probability of the test is computed as above, but from the associated database, if applicable.
Node Relative Significance with Respect to the Information Gain Brought by the Node to the Knowledge of the Target Value
-
For each value of the target, except for the filtered state, a list of nodes is sorted in descending order according to their relative contribution to the knowledge of the target value (if the node has only two states, this list is identical to the preceding one).
-
The nodes that do not bring any information do not appear in this list. That corresponds to the Target State Analysis.
-
Binary Mutual Information: Amount of information brought by each variable to the knowledge of the state of the target variable.
-
Binary Mutual Information (%): Amount of information brought by each variable to the knowledge of the state of the target variable compared to an unconnected network.
-
Binary Relative Significance: Ratio between the mutual information brought by each variable and the greatest mutual information.
-
Mean Value: Displays the nodes’ mean value of each target’s state.
-
Modal Value: For each influencing node, this describes the modal value (the most probable) with respect to the context and the observed state of the target node. This modal value comes with its probability. This section allows establishing the profile of this target value.
-
A priori Modal Value: For each influencing node, this describes the modal value when the target node is unobserved (but given the context). It makes it possible to define the profile when the target variable is unobserved.
-
Variation: Measure indicating the variation between the a priori modal value and the modal value when the target value is known. The formula used is . In Information Theory, this measure represents how many bits are won to represent the probability of X when the target value is known. Values printed in blue represent positive variations (the posterior probability of the modal value is greater than the prior one) while values printed in red represent negative variations. Obviously, no variation is reported if the posterior modal value is different from the prior modal value. The modal value is then displayed in blue.
-
Maximum Positive/Negative Variation: Measures indicating the states that have been the most impacted by the observation of the corresponding target state. The first one indicates the state with the greatest increase whereas the second one indicates the state with the greatest decrease.
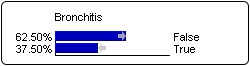
These measures correspond to the longest (right and left) gray arrows in the monitor (Inference mode) showing the probability variation of states. These measures are particularly useful for variables that have more than two states.
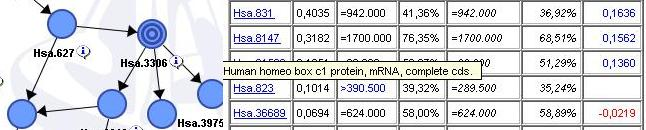
When a node has an associated comment, this node appears as an HTML link, and the comment can be displayed by hovering over the node.
Mapping
- If the target variable is a hidden variable, as is the case, for example, for the variable Cluster induced by Data Clustering, the Mapping button allows generating a mapping of the values of this variable.
Quadrants
The Quadrants button displays the Quadrant chart of the node’s relative significance with the target relative to each node’s mean:
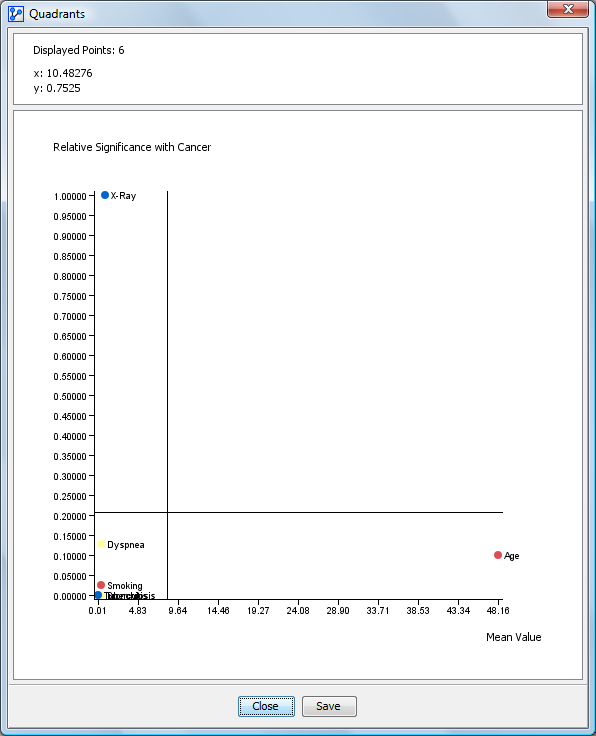
The points represent the variables. If a node has a color, then the point is displayed in that color. The node’s name is displayed to the right of the point. When moving the mouse over the point, the coordinates are displayed in the top panel. The top panel shows the number of points displayed as well as the evidence context. It is possible to zoom in on the chart as in the scatter of points.
The chart’s context menu allows you to:
- Display the nodes’ comments instead of their names.
- Copy the chart as an image or as a table of points (text or HTML).
- Print the chart
The chart is automatically resized when the size of the window changes. This chart is cut into four quadrants whose separations are:
- Along X-axis: the mean of the variables’ means
- Along Y-axis: the mean of the relative significance of the nodes with the target
- Quadrant 1: Top right: contains the important variables greater than the mean
- Quadrant 2: Bottom right: contains the important variables few or not important but greater than the mean
- Quadrant 3: Bottom left: contains the few or not important variables that are below the mean
- Quadrant 4: Top left: contains the important variables but that stay below the mean. It is possible to save the image of the chart in a file with the corresponding button.