Network Performance Analysis — Overall
Context
- The main purpose of Unsupervised Learning is to represent the joint probability distribution of the associated dataset compactly.
- One way to measure the performance of a Bayesian network B is to compute the Log-Loss values for all observations in the dataset from which network was learned.
Usage
- In Validation Mode, select
Main Menu > Analysis > Network Performance > Overall. - A new report window opens up featuring a graph plus a range of metrics.
The Report in Detail
The details of the resulting report depend on whether you have a Learning/Test Set split in your dataset or not.
Please review the topic relevant for your application:
Network Global Performance (Log-Likelihood)
This tool computes a global performance index of the network over the associated database. The computed value corresponds to the log-likelihood.
If the database contains a split dataset for learning and for testing, the analysis is done for each subset; otherwise it is done over the whole database. If a test dataset is available, we can also compare the results from the learning and the test set in a superimposed graph.
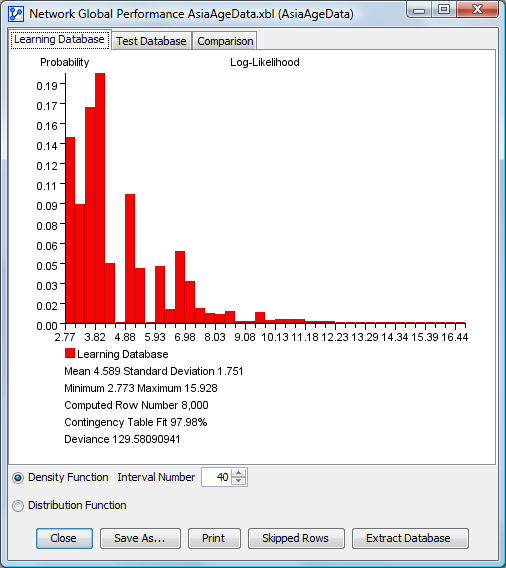
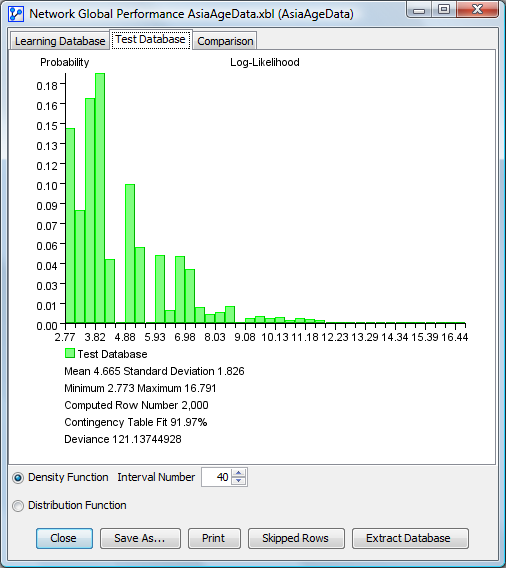
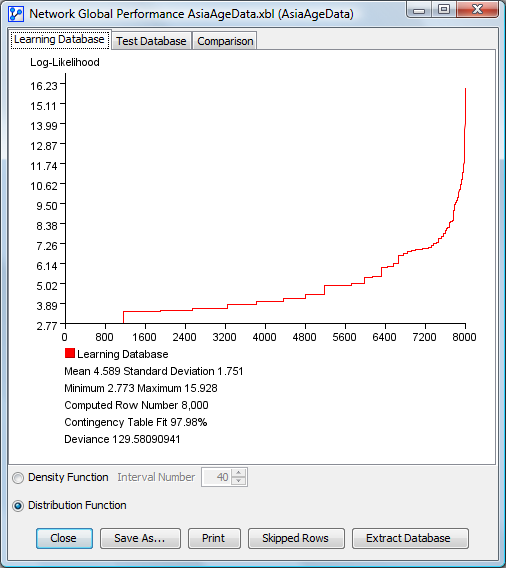
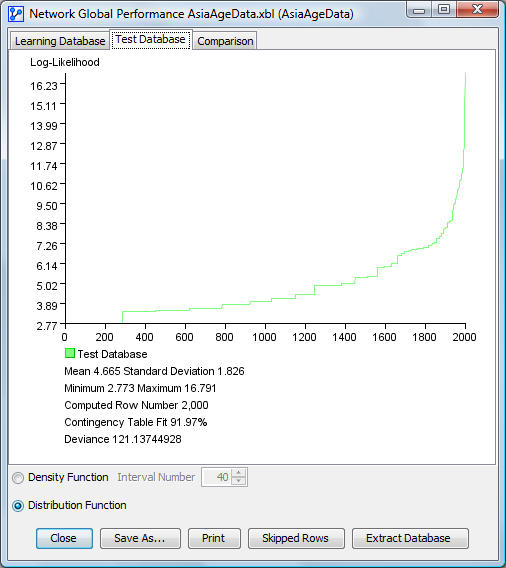
The results are displayed as graphs in a new window. There is a panel for each dataset, i.e. learning and test, plus one more for comparing both. For each dataset, you can see the results as a density function. The number of intervals can be modified dynamically. Alternatively, it can be shown as a distribution function.
For each panel, the mean, standard deviation, minimum, maximum and computed row numbers are indicated below the plot. In addition, three performance indices are displayed:
- Contingency Table Fit represents the degree of fit between the network’s joint probability distribution and the associated data. The better the network represents the database, the closer this value is to 100%. This measure, computed from the database’s mean log-likelihood is equal to 100% when the joint probability distribution is completely represented, such as with a fully connected network. Conversely, it is 0% when the joint is represented by a fully disconnected network. The dimensions represented by Not-Observable Nodes are excluded from the computation.
- Deviance: This measure is computed from the difference between the network’s mean log-likelihood and the database’s mean log-likelihood. The closer this value is to 0, the closer the network is to the database.
- The Kolmogorov-Smirnov Test is used to test the distribution similarity between two samples, i.e. learning and test, so this test is only computed for the comparison panel. More specifically, it compares the distributions of the log-likelihoods. The values Z, D and the corresponding p-value are displayed.
Density Function for the Learning Database
Density Function for the Test Database
Comparison between Density Functions for the Learning and the Test Databases
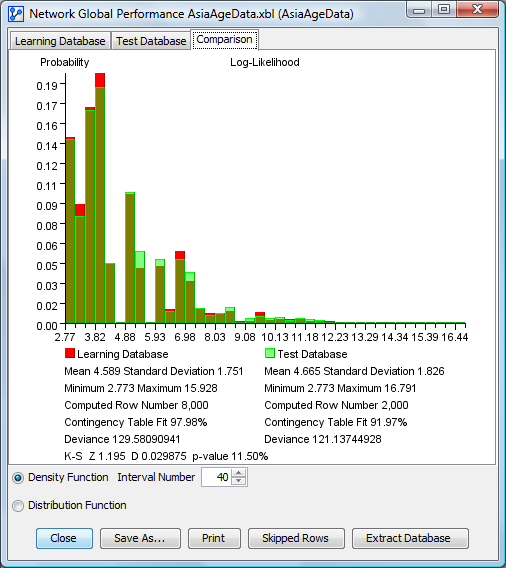
The results for learning are always represented in red and the results for test in green. The green bars for the test dataset are shown on top, while the red bars are shown in the layer behind. Both functions are at the same scale.
Distribution Function for the Learning Database
Distribution Function for the Test Database
Comparison between the Learning and Test Distribution Functions
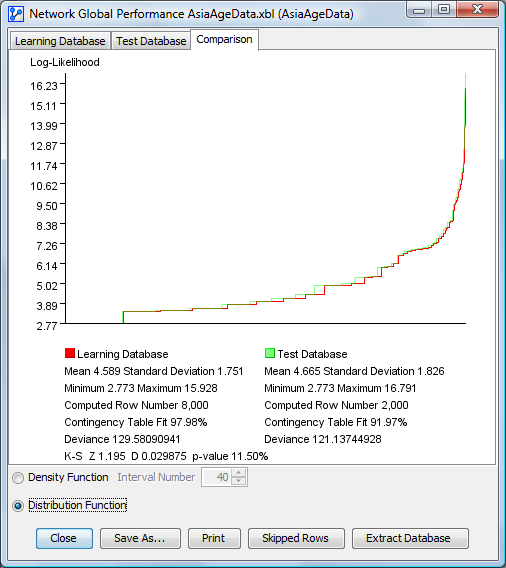
The results for learning are always represented in red and the results for test in green. The learning and test database graphics have the same vertical scale but don’t have a common horizontal scale. These curves are represented horizontally with the computed line percent of their own database.
Skipped Rows
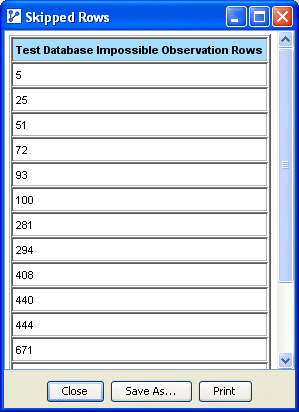
When an example of a database is impossible, i.e. it represents an impossible combination of evidences; the example is not taken in account in the final result and is displayed in a table in a HTML report. This report is displayed by pressing on the Skipped Rows button.
Extract Database
The Extract Database button allows saving only the examples of the database with log-likelihood contained in the specified interval, as shown in the following dialog box. The other parameters are the same as for database saving:

