Sensitivity Analysis — Expert Assessments
Context
- In the context of Bayesian networks designed by a group of experts via brainstorming, e.g., with BEKEE, the Assessment Sensitivity Analysis allows you to quantify the uncertainty associated with the probabilities generated through expert consensus.
- BayesiaLab estimates the variability of the probabilities by generating a set of networks based on the assessments given by the experts.
- Below are three different generation methods, ranked in increasing order of randomness:
- An expert is randomly chosen for each network;
- An expert is randomly chosen for each node of the network;
- An expert is randomly chosen for each conditional distribution, i.e., each combination of the node’s parents.
New Feature: Multi-Curve Graph
- Version 7.0 now allows plotting the density curves of all the states of a node in a single graph.
Example
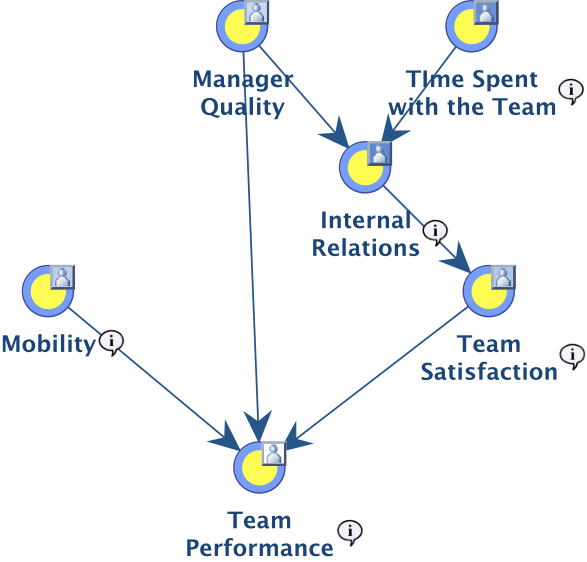
- Let’s use the network below, designed by a group of four experts:
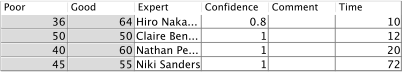
- The experts have given the following distributions for the node Manager Quality:
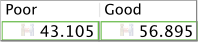
which results in this consensual distribution (that takes into account the confidence level of each expert):
-
For such a root node (i.e., without parents), the distribution of the node is defined by a single expert for all three network generation methods.
-
Let’s focus now on the node Internal Relations. It has two binary parents, thus defining four conditional probability distributions that have been assessed by our four experts, resulting in the following consensual conditional distributions:
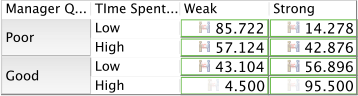
-
For this kind of node with parents, the third network generation method can lead to defining the table by using four different experts.
-
Below is the marginal distribution inferred with the consensual Bayesian network:
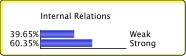
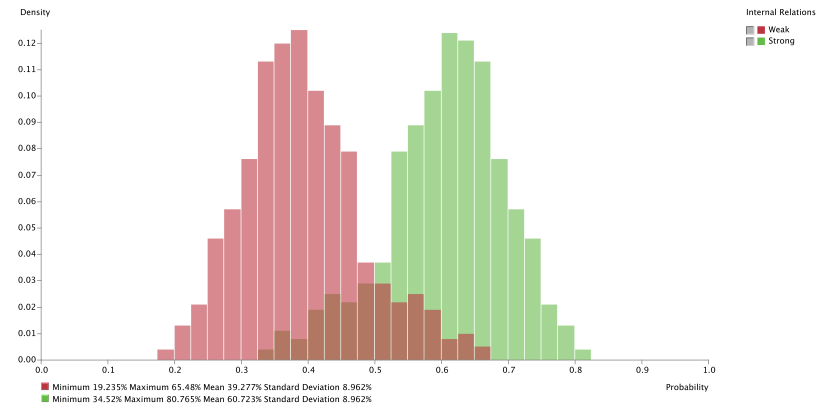
- Let’s generate 1,000 networks to measure the variability associated with the marginal distribution of this node. We randomly choose an expert per conditional distribution:

- As the multi-curve graph below indicates, the probability of Internal Relations=Weak ranges from 19% to 65%, with a mean value of 39%.