Structural/Target Precision Ratio
Context
- The Structure/Target Precision Ratio is one of the measures that can be computed in the Structural Coefficient Analysis and plotted in the Curve window.
- When plotted, the Structure/Target Precision Ratio can help you determine an appropriate value for the Structural Coefficient given your dataset and the learning algorithm you selected.
- As opposed to the Structure/Data Ratio, which is intended to be used primarily in the context of Unsupervised Learning, the Structure/Target Precision Ratio is meant for Supervised Learning.
- In the context of this ratio, “Structure” refers to the complexity of the network, and “Target Precision” represents the predictive performance with regard to the Target Node.
Usage
- To illustrate the Structure/Target Precision Ratio measure, we use a sample network that models wine quality perception as a function of physicochemical properties. The dataset, on which this model is based, is available from the UCI Machine Learning Repository .
-
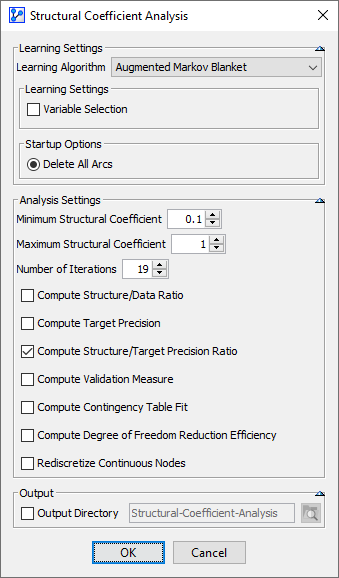
On this network, we perform a Structural Coefficient Analysis:
Main Menu > Tools > Multi-Run > Structural Coefficient Analysis. -
We follow the overall workflow introduced in Structural Coefficient Analysis.
-
Given that the Structure/Target Precision Ratio is particularly relevant in the context of Supervised Learning, we choose Augmented Markov Blanket as the Learning Algorithm and set a Structural Coefficient range from 0.1 to 1. The choice of 19 iterations provides 0.05 increments across the range.
-
The dataset associated with this model is split into a Learning Set and a Test Set, as indicated by the symbol tagged onto the database icon in the lower right-hand corner of the Graph Window.
-
Given the split, the Structural Coefficient Analysis calculates the Structure/Target Precision Ratio separately for the Learning Set and the Test Set.
-
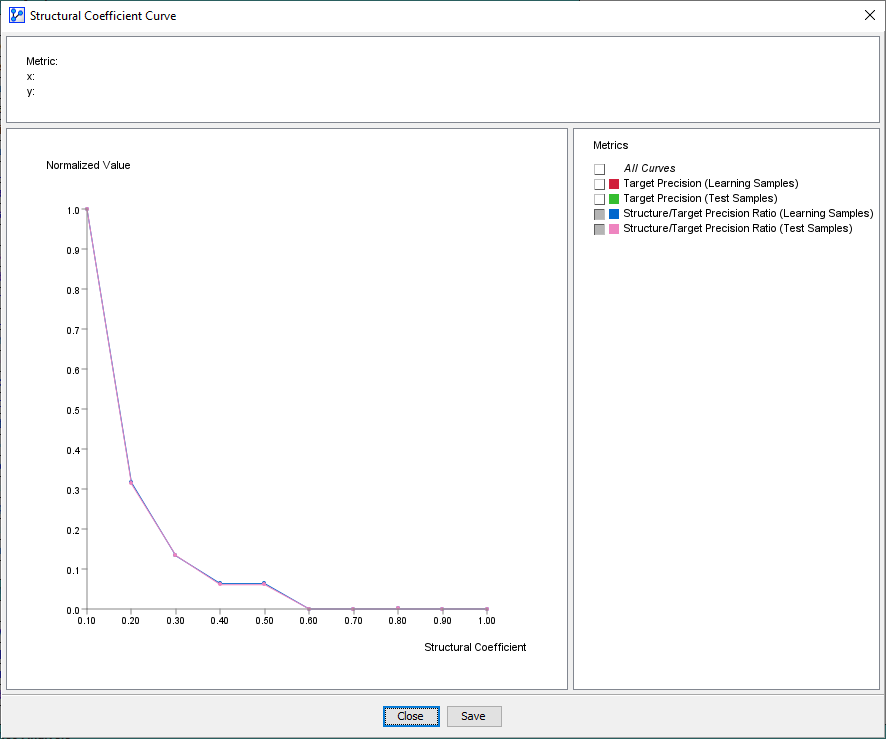
Upon clicking the Curve button at the bottom of the report, we obtain the following plot.
-
In the screenshot below, we have 19 x-y pairs (corresponding to 19 iterations) shown on the plot:
-
The x-axis represents the Structural Coefficient values.
-
The y-axis shows the Structure/Target Precision Ratio computed for each network learned with the corresponding value of the Structural Coefficient.
-
Note that the y-values are normalized to a 0 to 1 range, i.e., the smallest computed Structure/Target Precision Ratio is displayed as 0 and the largest value as 1.
-
Hovering over a point shows the normalized value plus the unnormalized value in parentheses.
Interpretation
- To interpret this graph, we need to read it from right to left. In this example, moving along the x-axis from 1 to 0.5, the curve remains fairly flat. This suggests that decreasing the Structural Coefficient keeps the ratio nearly constant. In other words, Target Precision and complexity remain within their respective order of magnitude.
- As we continue further to the left along the x-axis, i.e., , we observe an inflection of the curve. This tells us that the value of the numerator increases more rapidly than the denominator, meaning we gain a disproportionate amount of complexity without a corresponding gain in Target Precision.
- For , the curve accelerates rapidly upwards, implying that the complexity increases significantly.
- This would be a typical sign of overfitting. You generally want to avoid Structural Coefficient values in that portion of the curve.
- As a rule of thumb, a Structural Coefficient value at the inflection point of the curve (or “elbow”) or higher may represent a reasonable value.
- The differences between the curves of the Learning Set (red) and the Test Set (green) are minimal. For the most part, the curves track each other very closely or even coincide.